Our Terms & Conditions | Our Privacy Policy
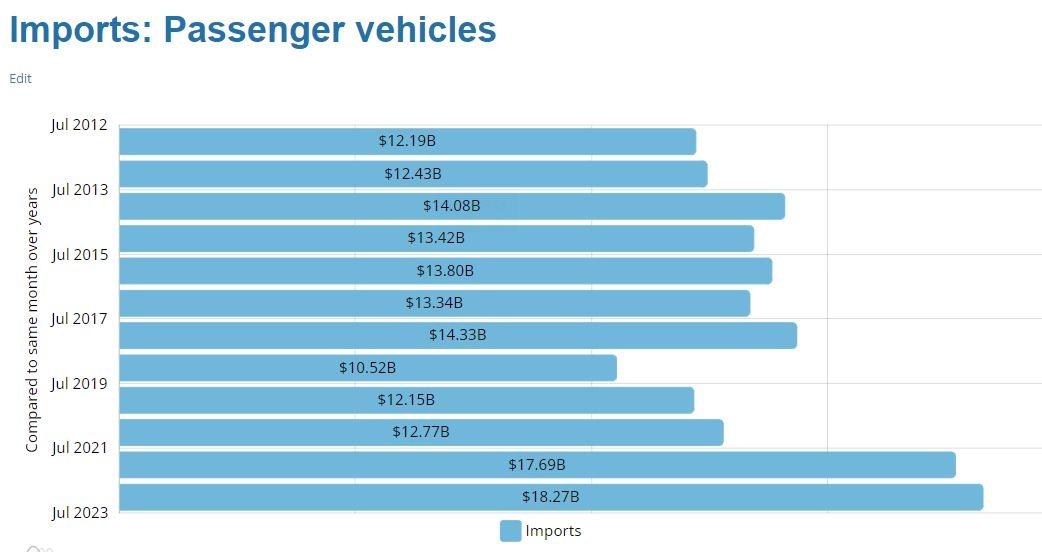
The category pf passenger vehicles, one of the imports that would be affected by a ILA strike that … [+] is likely to begin next week, is the top U.S. import by value this year. July data, the latest available, showed it to be the strongest July on record.
ustradenumbers.com
The East Coast and Gulf Coast seaports that would be affected by a longshoremen’s strike beginning next week are accounting for almost 60 percent of all containerized imports entering the United States this year, according to my analysis of the latest U.S. Census Bureau data.
The strike could affect the November presidential election, an early “October surprise” of sorts. That, in turn, could hinge on two things: its duration — the last one, in 1977, ended after 44 days — and whether President Biden sticks with his stance against forcing the two sides to resume negotiations, which the International Longshoremen broke off in June.
One example of a strike’s impact: About 40% of imported passenger vehicles enter at seaports on the East and Gulf Coasts, with the rest split between the West Coast or the Mexico and Canada borders.
That’s because the strike would affect not only traditional container ships — the majority of U.S. ocean trade by value — , which transport the containers that make their way to 18-wheelers and railroad cars. It would also affect “ro-ro” ships, where cars “roll on” in Japan, Korea, Germany and a number of other, mostly European countries and “roll off” in Brunswick, Ga., Baltimore, Newark and Jacksonville and elsewhere.
While pay and benefits are key issues, the real driver is automation. That pits the ILA against the European, Chinese and other Asian shipping lines as well as the terminal operators at affected U.S. seaports, represented by the United States Maritime Association, each of which depends on the other for the livelihood.
West Coast longshoremen, represented by a different union, recently averted a strike, gaining a 32% raise over the life of their contract. They agreed to some additional automation.
In this post, I will look at just the top 10 seaports jeopardized by an ILA work stoppage, which alone are accounting for better than 52% of the total:
- the Port of Newark,
- the Port of Savannah,
- the Port of Virginia,
- the Port of Houston,
- the Port of Charleston,
- PhilaPort in Pennsylvania,
- PortMiami,
- the Port of Baltimore,
- Port Everglades in Fort Lauderdale,
- the Port of Mobile.
While the Gulf and East Coast ports are accounting for 58.83% of all containerized cargo imports into the United States this year, just those on the East Coast are responsible for 49.70%. That is suggested by the above list: Only two of the above ports are on the Gulf Coast.
The strike, should it come to pass, would not directly affect bulk or break-bulk cargo. Think of things like cement, grains and petroleum products that don’t or need to arrive in a container, what those in the industry call “cans” or “boxes.” It would also not directly affect the cruise industry.
Mostly, a work-stoppage decision by ILA, whose feisty 78-year-old leader, Harold Daggett, was a young union member in 1977 during the last strike, would affect the containers handled by its members. Most media reports use a figure of around 45,000 members while the ILA website uses 85,000 members, but includes members outside the area of the likely work stoppage, and USMX uses a figure of 25,000.
At least this is clear: It is these containers — containerization — that created the pathway to global trade and the now often-maligned globalization that brought Americans enormously greater choice and lower prices and continued to push the nation’s workforce away from manufacturing and into the service sector.
Now, my findings from the U.S. Census Bureau data…
Passenger vehicles, medicine and furniture are examples of containerized cargo while gasoline and … [+] oil are not.
ustradenumbers.com
Port of Newark
The Port of Newark, generally paired with the Port of New York but not by Census, is the leading container port on the East Coast and second nationally only to the Port of Los Angeles.
Total containerized import cargo this year: $94.64 billion.
Percent of total import cargo that is containerized: 72.59%.
Growth in import containerized cargo this year: 4.61%.
Growth in overall import cargo: 2.69%.
Leading imports by containerized value, (percent containerized): medicines (46.94%), passenger vehicles (26.32%), furniture (98.58%).
Port of Savannah
The Port of Savannah ranks third nationally for the value of its containerized cargo imports through July, the most recent U.S. Census Bureau data available. As a right-to-work state, dockworkers are not required to the ILA members, though the belief is that non-unionized workers would not cross the picket line.
Total containerized import cargo this year: $53.47 billion.
Percent of total import cargo that is containerized: 95.18%.
Growth in import containerized cargo this year: 0.84%.
Growth in overall import cargo: 0.62%.
Leading imports by containerized value, (percent containerized): Motor vehicle parts (99.55%), medicines (99.82%), prepared foods, beverages (100%).
All five of the Port of Virginia’s top imports by value are largely shipped via container.
ustradenumbers.com
Port of Virginia
The Port of Virginia ranks fourth nationally for the value of its containerized cargo imports through July, the most recent U.S. Census Bureau data available.
Total containerized import cargo this year: $40.97 billion.
Percent of total import cargo that is containerized: 96.35%.
Growth in import containerized cargo this year: 7.37%.
Growth in overall import cargo: 7.40%.
Leading imports by containerized value, (percent containerized): Medicines (99.90%), printers (99.79%), motor vehicle parts (99.56%).
Port of Houston
What U.S. Census calls the Port of Houston includes imports and exports from other terminal operators in the lengthy Houston shipping channel not affiliated with Port Houston. It ranks first among Gulf Coast ports, fourth among those container ports that would be affected by a strike and fifth nationally. Because of its extensive oil and refined petroleum trade, its percentage of containerized cargo is low, relative to most seaports.
Total containerized import cargo this year: $38.91 billion.
Percent of total import cargo that is containerized: 69.39%.
Growth in import containerized cargo this year: -10.53%.
Growth in overall import cargo: -9.90%.
Leading imports by containerized value, (percent containerized): Solar panels, etc.(99.86%), power supplies, transformers (77.88%), taps and valves for pipes (96.55%).
All five of the Port of Charleston’s top-ranked imports are largely shipped via container.
ustradenumbers.com
Port of Charleston
The Port of Charleston ranks seventh nationally and fourth on the East Coast for the value of if containerized imports this year. It trails the Port of Houston by the narrowest of margins.
Total containerized import cargo this year: $38.56 billion.
Percent of total import cargo that is containerized: 93.04%.
Growth in import containerized cargo this year: 0.84%.
Growth in overall import cargo: 1.36%.
Leading imports by containerized value, (percent containerized): Vaccines, plasma and other blood fractions (100%), motor vehicle parts (99.80%), motor vehicle engines (100%).
PhilaPort
The port in Philadelphia is the nation’s No. 10-ranked container port by value for imports this year, a fast-growing port that has surpassed the Port of Baltimore, crippled by a bridge collapse, and PortMiami. It is fifth on the East Coast. Its percentage of containerized cargo, however, is lower than that of Houston. The vast majority of passenger vehicles are not being counted as containerized. Passenger vehicles generally travel on “ro-ro” vessels, which allow the vehicles to “roll on” and “roll off” through an opening beneath the deck. Not technically containerized.
Total containerized import cargo this year: $11.17 billion.
Percent of total import cargo that is containerized: 50.11%.
Growth in import containerized cargo this year: 16.22%.
Growth in overall import cargo: 13.89%.
Leading imports by containerized value, (percent containerized): frozen beef (99.94%), radioactive elements, isotopes (100%), passenger vehicles (14.59%).
PortMiami
The Miami seaport remain the No. 11 overall seaport for imports of containerized cargo through July, down slightly from a record-setting pace in 2023.
Total containerized import cargo this year: $10.66 billion.
Percent of total import cargo that is containerized: 92.84%.
Growth in import containerized cargo this year: -4.56%.
Growth in overall import cargo: -4.74%.
Leading imports by containerized value, (percent containerized): cigars, cigarettes (98.99%), T-shirts (99.79%), insulated wire and cable (99.73%).
Port of Baltimore
When it rains, it pours. A labor strike would make for a particularly tough year for the Port of Baltimore, which had its primary span to the seaport knocked down earlier this year by a wayward container ship. It ranked 10th nationally last year through the first seven months of the year. Somehow fittingly, this year it ranks No. 13 among the nation’s seaports for containerized imports. Given the challenges it faced earlier this year and continues to face, it has seen a drop in imports and even in the percentage of its trade that is containerized. Its passenger vehicles, like those at the Port of Charleston, generally are not counted as containerized.
Total containerized import cargo this year: $8 billion.
Percent of total import cargo that is containerized: 32.59%.
Growth in import containerized cargo this year: -28.24%.
Growth in overall import cargo: -28.28%.
Leading imports by containerized value, (percent containerized): passenger vehicles (10.77%), radioactive elements, isotopes (100%), vaccines, plasma and other blood fractions (99.94%).
Port Everglades
Port Everglades, which sits just north of PortMiami in Fort Lauderdale, ranks No. 8 for imports among container ports on the East Coast, 14th nationally. The only seven-month stretch better than this year for the port was in 2022.
Total containerized import cargo this year: $6.41 billion.
Percent of total import cargo that is containerized: 83.19%.
Growth in import containerized cargo this year: 2.98%.
Growth in overall import cargo: 2.53%.
Leading imports by containerized value, (percent containerized): medical instruments (98.63%), sweaters (99.45%), T-shirts (98.99%).
Port of Mobile
It was automation discovered to be in use at the Port of Mobile, the No 10-ranked seaport for containerized imports subject to the expiring ILA contract, that led the union to break off talks with management. It is one of two Gulf ports among the top 10; the Port of Houston is the other.
Total containerized import cargo this year: $6.30 billion.
Percent of total import cargo that is containerized: 55.81%.
Growth in import containerized cargo this year: -1.76%.
Growth in overall import cargo: -1.53%.
Leading imports by containerized value, (percent containerized): motor vehicle parts (99.99%), electric storage batteries (100%), solar panels, etc. (100%).
Images are for reference only.Images and contents gathered automatic from google or 3rd party sources.All rights on the images and contents are with their legal original owners.
Aggregated From –
Comments are closed.