Our Terms & Conditions | Our Privacy Policy
Mabrian reveals promising travel trends for Oceania but highlights uneven air connectivity recovery as a challenge for growth.
As the travel industry in Oceania continues to bounce back from the pandemic, the latest insight from Mabrian, the global travel intelligence platform, reveals promising travel intention trends from markets like the United States, India, China, and Europe, signalling potential growth for 2024 and beyond, as well as overall travel demand recovery; as Oceania is facing an uneven recouping in air connectivity, a key challenge to be addressed to harness the demand trends. Mabrian, part of The Data Appeal Company – Almawave Group, shared this analysis with the World Travel & Tourism Council, hosting its Global Summit 2024 from October 8th to 10th, 2024 in Perth, Australia.
Oceania is formed by 14 countries (UN Statistics Board) grouped in four macro-regions: Australia & New Zealand, Melanesia, Micronesia and Polynesia, the majority of them islands of different sizes. The continent boasts exceptional diversity, turning this area of the world in a bucket-list destination for outdoors, nature and adventure lovers; as well as for travellers, eager to explore the unique cultural expressions and heritage of its native communities.
According to UN Tourism‘s latest year-round data (2023), arrivals (17.46M arrivals in 2019 vs 12.87M in 2023) and international tourist receipts (61.4 USD billion in 2019 vs 57.9 USD billion in 2023) to Oceania is close to reaching 2019 records. As many destinations around the world, the pandemic posed extreme challenges to travel & tourism industry in the region and, for Oceania, recovery took longer: The majority of destinations fully reopened in early 2022, or later than same year, being the restrictions among the toughest globally, similar to some Asian countries, which were key source markets for Oceania’s destinations. Demand reconfigured between 2020 and 2023, where it showed signs of bouncing back to traditional arrivals’ trends.
But, how do 2024 and early 2025 look like for Oceania, in terms of travel demand? To perform this analysis, Mabrian dig into two indicators: seats availability variation and scheduling to understand to what extent connectivity recovered after the pandemic, and Share of Searches Index* for Oceania, based on flight searches for the first semester of 2024, to travel throughout 2024 and until late winter 2025.
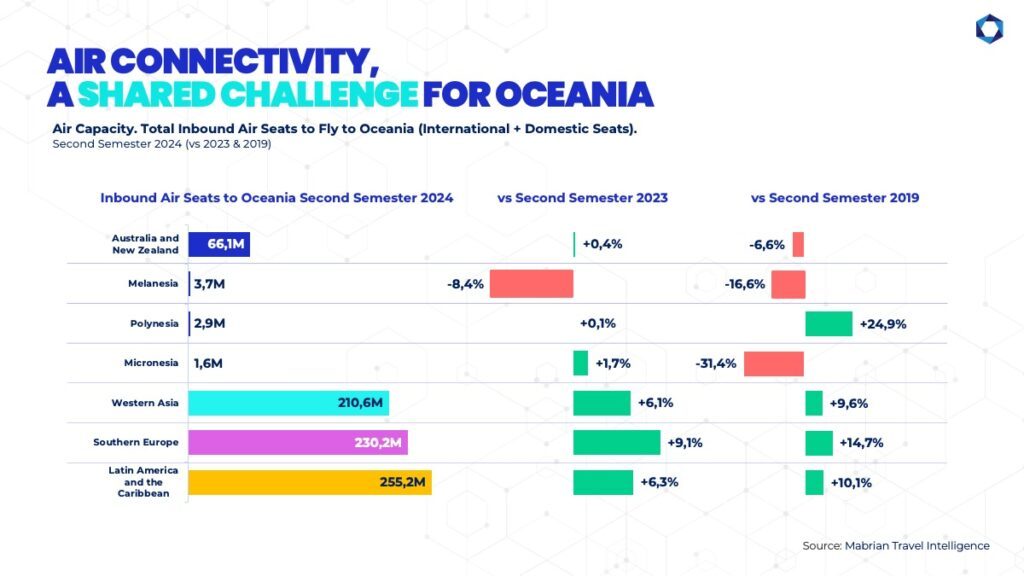
Air Connectivity, A Shared Challenge for Oceania
Due to its geography, Oceania is highly dependent on the air connectivity, domestic, regional, and international, so it is a crucial competitiveness factor for this continent. According to Mabrian’s travel intelligence, overall regional connectivity to and within Oceania’s countries has not fully recovered after the pandemic. When comparing scheduled inbound and domestic air seats for the second half of 2024 with 2019 same period, for Oceania’s four macro regions that conform Oceania (Australia & New Zealand, Melanesia, Micronesia and Polynesia), data shows that only Polynesia is 25% above 2019 figures, while Micronesia is -31% below, Melanesia -17%, and Australia & New Zealand are -7% 2019 levels.
“The path to recovery in terms of air capacity is slower when compared to other world regions, in particular some with a strong travel & tourism market, such as Southern Europe, Western Asia or Latin America, recovering +10% to 15% of 2019 seats, posing a relevant challenge to be addressed considering the characteristic insularity of Oceania”, indicates Carlos Cendra, Partner and Director of Marketing and Communications at Mabrian.
Focusing on inbound air seats to scheduled Oceania’s destinations for the full year 2024 (compared to 2023 and 2019), Mabrian’s travel intelligence shows that air capacity recovery is progressive, and indicates an uneven recoup of air connectivity in the area favouring four destinations: Tahiti (French Polynesia), Nadi (Fiji), as well as Perth and the Sunshine Coast (Australia).
Tahiti (French Polynesia) increased +29% air seat availability compared 2019 and +1% growth compared to 2023; whereas, since 2019, Nadi (Fiji) grew +24% inbound air seats, +10% when compared to 2023. Perth (+9% more seats than 2019 and +13% year over year) and the Sunshine Coast (+33% more than in 2019, even though reduced -12% since last year) are the exceptions to other Australian destinations, such as Sydney, Melbourne or Brisbane, or even to Auckland (New Zealand), all of them increasing air connectivity inter-annually, but still below 2019 seats availability.
Finally, when compared to full 2019, scheduled air seats indicate that inbound air connectivity is bouncing back +5% to Auckland (New Zealand), and +4% to both Queenstown (Australia) and to Port Moresby (Papua New Guinea). In fact, the capital of Papua New Guinea features a strong growing trend, as air seats’ availability increases +13% year over year.
Demand timidly recovers in India, US and Europe, and China’s bounce back
Mabrian’s Share of Searches Index, based on flight searches for the first semester of 2024, to travel throughout 2024 and until late winter 2025; reveals that United States, India, China, and Europe, key markets of Oceania, are showing signs of recovery or stabilization.

Travel intention from the Chinese market is the steadiest, as grows up to +4.7% compared to the same period last year. India also shows a moderate +1.4% inter-annual growth in inspirational demand, while Europe (+1% year over year) and United States (+0.8% year over year) increases also indicate a paced recovery. “Travel intention data is very promising, as it will contribute to push the much-needed air seats availability to cater to it, as well as to pent-up demand that is considering travelling to Oceania in the medium and long-term”, explains Cendra.
Data illustrates the gap between travel intention and air connectivity. This difference is particularly acute for Sydney and Melbourne (Australia), and also for Auckland (New Zealand), where global seats availability has not recovered yet to 2019 levels. Inspirational demand to travel to Sydney during 2024 and until late winter 2025 from the United States, China or Europe tripled compared to the same period last years’, and increased 160% from India. In the case of Melbourne, demand from India multiplied by 3, from Europe increased 121%, from China grew 158%, and almost 80% from the United States. The appetite to visit New Zealand’s capital is also evident in these for markets, as travel intention grew year over year +86% from China, 79% from the United States, +70% from Europe and +60% from India.
As Mabrian’s spokesperson points out “Oceania’s destinations must follow up on these demand trends as it offers clear hints on which are the opportunity markets to tap into to reinforce and rebuild air connectivity to the region”.
*Mabrian’s Share of Searches Index is a proprietary index that reflects the strength of travel demand based on flight searches behaviour. Given a source market and a period of time, the Share of Searches Index is a percentage that correlates the total flight searches globally with spontaneous searches for specific destinations. Unlike confirmed bookings, this ratio shows the degree of market interest in certain destinations, and whether reservations are confirmed depends on many factors, from available connectivity, flight and accommodation prices, or other phenomena that may influence travellers’ willingness to purchase or spend.

Vicky is the co-founder of TravelDailyNews Media Network where she is the Editor-in Chief. She is also responsible for the daily operation and the financial policy. She holds a Bachelor’s degree in Tourism Business Administration from the Technical University of Athens and a Master in Business Administration (MBA) from the University of Wales. She has many years of both academic and industrial experience within the travel industry. She has written/edited numerous articles in various tourism magazines.
Images are for reference only.Images and contents gathered automatic from google or 3rd party sources.All rights on the images and contents are with their legal original owners.
Aggregated From –
Comments are closed.