Our Terms & Conditions | Our Privacy Policy

A new report on Australia’s innovation system, published by the Office of the Chief Economist, shows investment is still languishing despite almost half of businesses engaging in innovative activities.
The federal government said the Australian Innovation Statistics (AIS) report is a refreshed version of the Australian Innovation System Monitor, which the previous government ended in 2020.
AIS data is arranged in seven dashboards, each linked to an aspect of Australia’s innovation system. The outer circle includes key enabling factors of innovation:
- the domestic business environment (e.g. business competition, access to finance);
- international trade (e.g. import and export competition, knowledge spillovers from foreign direct investment);
- human capital and skills (e.g. workforce training; management capability);
- collaboration and networks (e.g. cross-sector partnerships); and
- R&D investment (e.g. private and public R&D expenditure).
The 2 inner circles highlight Australian innovation outcomes. This includes the creation of new technology and knowledge, the adoption of existing technology and knowledge, and metrics on productivity growth. Productivity growth is the main way that innovation impacts the economy, the AIS said.
The AIS metrics track key enabling factors of innovation relating to the domestic business environment, collaboration, skills, international trade and R&D expenditure.
“These factors combine to deliver innovation outcomes, including the creation and diffusion of knowledge and technology, and subsequent impacts on the economy,” it said.
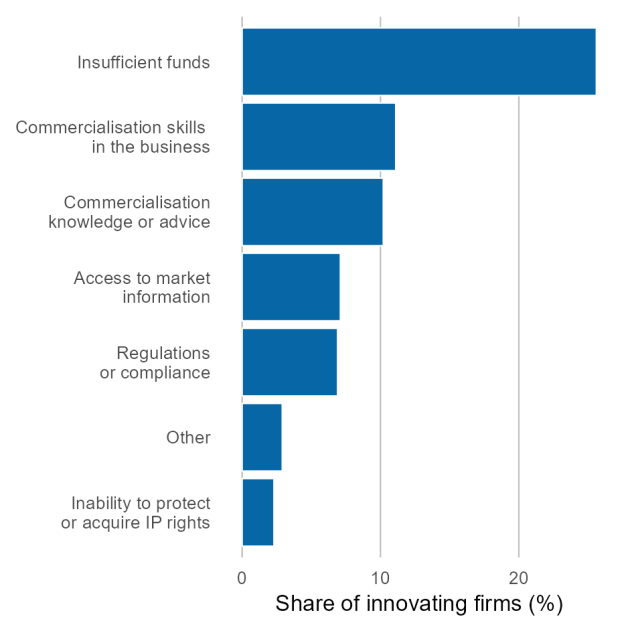
The AIS dashboard shows Australia’s research efforts are “strong”, with an increase in published scientific papers and collaborations. But it also reveals low investment and that access to funding has overtaken cost and access to skills as the main barrier for businesses commercialising innovation.

Barriers to innovation commercialisation, 2022-23: The most common barriers to commercialisation are insufficient funds and lack of commercialisation skills within the business. Note: Firms were able to select multiple barriers. Source: ABS 2024c (Source: Australian Innovation Statistics/industry.gov.au)
Other findings in the report show the number and volume of venture capital deals continuing to decline.
Skills acquisition, and matching businesses with sources of finance, both remain the most common barriers to innovation for businesses.
Industry minister, Ed Husic, said, “We can’t put our head in the sand and pretend this isn’t happening, we need good data and an honest appraisal of what the barriers are to lifting R&D.
“While there have been encouraging signs in institutional R&D uplift, we still have a lot of work to do.”
Barriers to Firm Innovation: The most common barriers to innovation are lack of skills and access to additional funds. Source: ABS 2012a, 2018c, 2024c (Source: Australian Innovation Statistics/industry.gov.au)
The government’s $14.4 billion investment in 2024-25 includes $4.3 billion in industry R&D tax measures, and $10.1 billion in other budgetary allocations. Together these represent a 4.7 per cent increase in nominal terms from the $13.8 billion allocated in 2023-24, the report said.
The 2024–25 investments are spread over 151 programs and 14 portfolios.
Government investment in R&D continues to grow in nominal terms, and in 2024-25, is equivalent to 0.52 per cent of GDP. The AIS said this is around the average share recorded since 2018-19, but below the most recent OECD average of 0.74 per cent.
Chart one shows almost half (45.7 per cent) of Australian businesses took part in innovative activities in 2022-23. These figures are the highest recorded over the last decade, excluding a surge during the pandemic, which drove an intense period of innovation. Australia performs well to its peers on this metric, ranking seventh out of 39 countries in the latest OECD innovation survey, held in 2023.

Innovation-active firms, top and bottom industries: Innovation has become more prevalent in all depicted industries since 2010–11. The middle eleven industries in 2022–23 are not included in this chart. Source: ABS 2012a, 2018c, 2024c(Source: Australian Innovation Statistics/industry.gov.au)
Australia’s positive innovation performance has come despite a backdrop of challenging business conditions. For example, innovation relies on software, machinery and R&D investment to take advantage of both existing technologies, and to develop new ones. But Australia has seen either a decline or low growth in these knowledge-intensive types of capital as a share of GDP since the mid-1990s.
Its innovation model is still one of diffusion, with 94.8 per cent of innovations adopted by Australian business already existing. Although, in this context there are signs of increased innovation creation. The number of new to world innovations produced in Australia has increased since the pandemic, up to 5.2per cent in 2022-23 from 4.7 per cent in 2020-21.
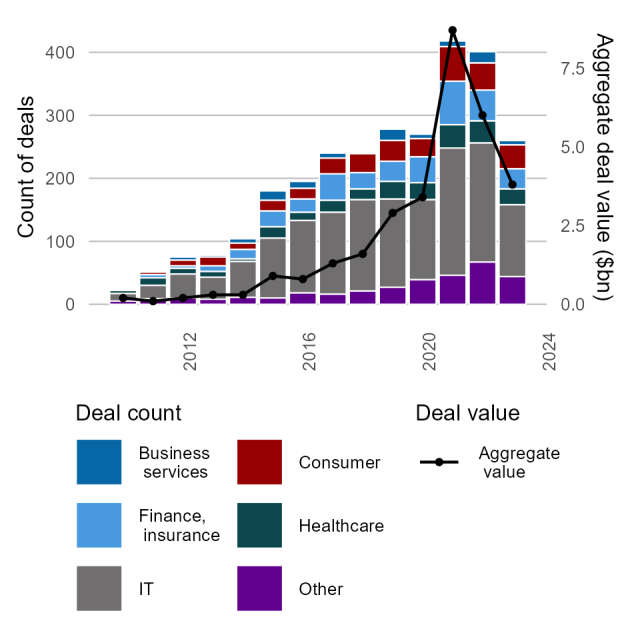
Venture capital, deals and aggregate deal value: The total venture capital deals have increased from 2010 to 2023, along with the overall value of these transactions. Alternative data sources on venture capital show similar trends. Source: AIC/Preqin 2024 (Source: Australian Innovation Statistics/industry.gov.au)
Images are for reference only.Images and contents gathered automatic from google or 3rd party sources.All rights on the images and contents are with their legal original owners.
Aggregated From –
Comments are closed.