Our Terms & Conditions | Our Privacy Policy
The current price of Bitcoin (BTC) today is $66,064.0 as of 4 PM. As if Wednesday, BTC price hit a daily high of $67,740.0 today after sliding -1.36% on October 23.
Why is Bitcoin price Down Today?
Bitcoin price today dropped 0.70% and trades at $66,953 on October 23, 2024. Although the weekend rally pushed BTC above $69,000, the sell-off since then has led to a near-4% crash.
Bitcoin Price Performance Chart
*bitcoin price updated as of 4 PM.
Bitcoin’s popularity is due to its innovativeness of being the first successful digital money. Since then, many narratives have kept BTC at the forefront of the crypto market since 2009. BTC’s first-mover advantage and similarity to gold have made it an even better investment asset.
Over the past year, price of BTC today has yielded a whopping 52% return, while the second-largest cryptocurrency by market capitalization, Ethereum, stands at 18%, disappointing investors.
Bitcoin’s Price History
The year-to-date (YTD) performance of BTC has dropped to 52% after hitting a peak of 74% in early March 2024. With the US elections coming to a close, many speculate Bitcoin price will witness massive volatility and a run to new all-time highs (ATHs). Although the current market capitalization of BTC stands at $1,305.5 billion, it could go beyond $2 trillion this cycle.
Bitcoin: The Second-Largest Cryptocurrency
Clubbing Bitcoin’s $1,305.5 billion market cap with Ethereum’s (BTC) $314 billion constitutes nearly 70% of the total crypto market capitalization. This duo is likely to capture a bigger share in the upcoming bull run that will start after the US presidential election decision on November 5.
Despite the seven-month consolidation, Bitcoin’s $1.3 trillion market cap towers over other popular cryptos like Solana (SOL) and Ripple (XRP), whose market capitalization hovers around $78 billion and $30 billion.
Bitcoin’s Trading Volume
Despite the recent drop in Bitcoin price, the 24-hour trading volume of bitcoin is $30.4 billion. Binance, one of the largest cryptocurrency exchanges, contributes about 11% to the spot trading volume and nearly 41% to the perpetuals’ trading volume. Exchanges like OKX, Bitget, etc follow Binance. Popular cryptocurrencies like SOL, XRP, and BNB have at least several times lower trading volume than BTC.
Bitcoin Network Upgrades
The updates add security, increase decentralization, and improve scalability. So far, Bitcoin’s network has scaled massively, without compromising security or decentralization. However, some believe BTC needs to scale further to become a global monetary network.
Here are some notable upgrades the Bitcoin network has received or planned to receive since its inception in 2009.
Bitcoin Blockchain Upgrades Since Inception, 2009
Here are some key milestone upgrades to the Bitcoin network over the past decade.
2017-2019
2015-2016
2013-2014
2010-2012
2009-2010
Bitcoin Price Prediction & Trends
The recent downtrend in Bitcoin price can be attributed to the cyclical nature of buyers and sellers, which has kept BTC rangebound for the past seven months. Perhaps the consolidation could be explained by taking into account the US election, which many investors are anticipating. A conclusion to this event could induce massive volatility and target liquidity on either side, leading to whipsaws.
As a result, the next few weeks are critical in determining where Bitcoin goes next.
Bitcoin prices 2024
As of ‘October 23, here are some popular cryptocurrencies’ price-performance comparisons. The one-month performance shows BTC is up 4.73%, while year-to-date returns show BTC at 58,246.46%
Although Bitcoin price today trades at $66,953, investors can expect a shocking performance if BTC ends its seven-month consolidation and heads for new all-time high.
Bitcoin Price For Next 30 Days
| Date | Price | Change |
|---|---|---|
| October 16, 2024 | $68,424 | 3.04% |
| October 17, 2024 | $73,885 | 11.26% |
| October 18, 2024 | $76,476 | 15.16% |
| October 19, 2024 | $77,293 | 16.39% |
| October 20, 2024 | $78,415 | 18.08% |
| October 21, 2024 | $79,327 | 19.45% |
| October 22, 2024 | $80,179 | 20.74% |
| October 23, 2024 | $80,978 | 21.94% |
| October 24, 2024 | $80,840 | 21.73% |
| October 25, 2024 | $79,470 | 19.67% |
| October 26, 2024 | $77,725 | 17.04% |
| October 27, 2024 | $76,910 | 15.81% |
| October 28, 2024 | $77,225 | 16.29% |
| October 29, 2024 | $79,982 | 20.44% |
| October 30, 2024 | $85,101 | 28.15% |
| October 31, 2024 | $87,093 | 31.15% |
| November 01, 2024 | $87,885 | 32.34% |
| November 02, 2024 | $87,902 | 32.37% |
| November 03, 2024 | $87,406 | 31.62% |
| November 04, 2024 | $87,216 | 31.33% |
| November 05, 2024 | $87,399 | 31.61% |
| November 06, 2024 | $87,871 | 32.32% |
| November 07, 2024 | $87,962 | 32.46% |
| November 08, 2024 | $88,423 | 33.15% |
| November 09, 2024 | $89,098 | 34.17% |
| November 10, 2024 | $89,912 | 35.39% |
| November 11, 2024 | $89,276 | 34.44% |
| November 12, 2024 | $89,923 | 35.41% |
| November 13, 2024 | $91,603 | 37.94% |
| November 14, 2024 | $92,226 | 38.88% |
Based on the Bitcoin price prediction, investors can expect a 13.44% rally from BTC in the next week. This outlook suggests BTC price could trade at around $79,982 on October 29, 2024.
Bitcoin Prices Outlook Between 2025 and 2029
| January | $64,079.99 | $96,011.97 | $80,045.98 |
28.7% |
| February | $67,376.97 | $96,338.54 | $81,857.76 |
31.7% |
| March | $70,673.96 | $96,665.12 | $83,669.54 |
34.6% |
| April | $73,970.94 | $96,991.69 | $85,481.32 |
37.5% |
| May | $77,267.93 | $97,318.26 | $87,293.10 |
40.4% |
| June | $80,564.92 | $97,644.83 | $89,104.88 |
43.3% |
| July | $83,861.90 | $97,971.40 | $90,916.65 |
46.2% |
| August | $87,158.89 | $98,297.97 | $92,728.43 |
49.1% |
| September | $90,455.87 | $98,624.55 | $94,540.21 |
52.1% |
| October | $93,752.86 | $98,951.12 | $96,351.99 |
55% |
| November | $97,049.84 | $99,277.69 | $98,163.77 |
57.9% |
| December | $100,346.83 | $99,604.26 | $99,975.55 |
60.8% |
| All Time | $82,213.41 | $97,808.12 | $90,010.76 |
44.8% |
| January | $103,147.68 | $102,868.91 | $105,266.25 |
69.3% |
| February | $105,948.53 | $106,133.55 | $110,556.96 |
77.8% |
| March | $108,749.37 | $109,398.20 | $115,847.66 |
86.3% |
| April | $111,550.22 | $112,662.84 | $121,138.37 |
94.8% |
| May | $114,351.07 | $115,927.49 | $126,429.07 |
103.4% |
| June | $117,151.92 | $119,192.13 | $131,719.78 |
111.9% |
| July | $119,952.76 | $122,456.78 | $137,010.48 |
120.4% |
| August | $122,753.61 | $125,721.42 | $142,301.18 |
128.9% |
| September | $125,554.46 | $128,986.07 | $147,591.89 |
137.4% |
| October | $128,355.31 | $132,250.71 | $152,882.59 |
145.9% |
| November | $131,156.15 | $135,515.36 | $158,173.30 |
154.4% |
| December | $133,957 | $138,780 | $163,464 |
162.9% |
| All Time | $118,552.34 | $120,824.45 | $134,365.13 |
116.1% |
| January | $139,801.17 | $144,684.75 | $169,276.92 |
172.3% |
| February | $145,645.33 | $150,589.50 | $175,089.83 |
181.6% |
| March | $151,489.50 | $156,494.25 | $180,902.75 |
191% |
| April | $157,333.67 | $162,399 | $186,715.67 |
200.3% |
| May | $163,177.83 | $168,303.75 | $192,528.58 |
209.7% |
| June | $169,022 | $174,208.50 | $198,341.50 |
219% |
| July | $174,866.17 | $180,113.25 | $204,154.42 |
228.4% |
| August | $180,710.33 | $186,018 | $209,967.33 |
237.7% |
| September | $186,554.50 | $191,922.75 | $215,780.25 |
247.1% |
| October | $192,398.67 | $197,827.50 | $221,593.17 |
256.4% |
| November | $198,242.83 | $203,732.25 | $227,406.08 |
265.8% |
| December | $204,087 | $209,637 | $233,219 |
275.1% |
| All Time | $171,944.08 | $177,160.88 | $201,247.96 |
223.7% |
| January | $212,511.67 | $218,298 | $243,655 |
291.9% |
| February | $220,936.33 | $226,959 | $254,091 |
308.7% |
| March | $229,361 | $235,620 | $264,527 |
325.5% |
| April | $237,785.67 | $244,281 | $274,963 |
342.3% |
| May | $246,210.33 | $252,942 | $285,399 |
359% |
| June | $254,635 | $261,603 | $295,835 |
375.8% |
| July | $263,059.67 | $270,264 | $306,271 |
392.6% |
| August | $271,484.33 | $278,925 | $316,707 |
409.4% |
| September | $279,909 | $287,586 | $327,143 |
426.2% |
| October | $288,333.67 | $296,247 | $337,579 |
443% |
| November | $296,758.33 | $304,908 | $348,015 |
459.8% |
| December | $305,183 | $313,569 | $358,451 |
476.5% |
| All Time | $258,847.33 | $265,933.50 | $301,053 |
384.2% |
| January | $317,150.58 | $326,144.33 | $372,391.92 |
499% |
| February | $329,118.17 | $338,719.67 | $386,332.83 |
521.4% |
| March | $341,085.75 | $351,295 | $400,273.75 |
543.8% |
| April | $353,053.33 | $363,870.33 | $414,214.67 |
566.2% |
| May | $365,020.92 | $376,445.67 | $428,155.58 |
588.7% |
| June | $376,988.50 | $389,021 | $442,096.50 |
611.1% |
| July | $388,956.08 | $401,596.33 | $456,037.42 |
633.5% |
| August | $400,923.67 | $414,171.67 | $469,978.33 |
655.9% |
| September | $412,891.25 | $426,747 | $483,919.25 |
678.4% |
| October | $424,858.83 | $439,322.33 | $497,860.17 |
700.8% |
| November | $436,826.42 | $451,897.67 | $511,801.08 |
723.2% |
| December | $448,794 | $464,473 | $525,742 |
745.6% |
| All Time | $382,972.29 | $395,308.67 | $449,066.96 |
622.3% |
If BTC ends its slump and hits six-digit territory, investors can expect a kickstart to the explosive bull rally between 2025 and 2030. Based on Coingape’s Bitcoin price prediction, BTC prices could hover between $82,213.41 and $660,471.83.
In 2025, the smart contract token could exchange hands between $82,213.41 and $90,010.76, with a potential ROI of 30% from the current level. The bullish outlook is a common denominator between 2024 and 2030, and investors can expect BTC price to surpass the current ATH of $73,949 and set up a new one, close to the six-digit territory , in 2030.
Bitcoin Price Outlook between 2030 and 2050
2030
2031
2032
2033
2040
2050
| January | $465,154.42 | $481,462.17 | $546,469.67 |
779% |
| February | $481,514.83 | $498,451.33 | $567,197.33 |
812.3% |
| March | $497,875.25 | $515,440.50 | $587,925 |
845.6% |
| April | $514,235.67 | $532,429.67 | $608,652.67 |
879% |
| May | $530,596.08 | $549,418.83 | $629,380.33 |
912.3% |
| June | $546,956.50 | $566,408 | $650,108 |
945.7% |
| July | $563,316.92 | $583,397.17 | $670,835.67 |
979% |
| August | $579,677.33 | $600,386.33 | $691,563.33 |
1012.3% |
| September | $596,037.75 | $617,375.50 | $712,291 |
1045.7% |
| October | $612,398.17 | $634,364.67 | $733,018.67 |
1079% |
| November | $628,758.58 | $651,353.83 | $753,746.33 |
1112.4% |
| December | $645,119 | $668,343 | $774,474 |
1145.7% |
| All Time | $555,136.71 | $574,902.58 | $660,471.83 |
962.3% |
| January | $667,167.08 | $691,240.58 | $802,526.58 |
1190.8% |
| February | $689,215.17 | $714,138.17 | $830,579.17 |
1235.9% |
| March | $711,263.25 | $737,035.75 | $858,631.75 |
1281.1% |
| April | $733,311.33 | $759,933.33 | $886,684.33 |
1326.2% |
| May | $755,359.42 | $782,830.92 | $914,736.92 |
1371.3% |
| June | $777,407.50 | $805,728.50 | $942,789.50 |
1416.4% |
| July | $799,455.58 | $828,626.08 | $970,842.08 |
1461.5% |
| August | $821,503.67 | $851,523.67 | $998,894.67 |
1506.7% |
| September | $843,551.75 | $874,421.25 | $1,026,947.25 |
1551.8% |
| October | $865,599.83 | $897,318.83 | $1,054,999.83 |
1596.9% |
| November | $887,647.92 | $920,216.42 | $1,083,052.42 |
1642% |
| December | $909,696 | $943,114 | $1,111,105 |
1687.1% |
| All Time | $788,431.54 | $817,177.29 | $956,815.79 |
1439% |
| January | $946,061.92 | $979,838.83 | $1,150,786.08 |
1751% |
| February | $982,427.83 | $1,016,563.67 | $1,190,467.17 |
1814.8% |
| March | $1,018,793.75 | $1,053,288.50 | $1,230,148.25 |
1878.6% |
| April | $1,055,159.67 | $1,090,013.33 | $1,269,829.33 |
1942.4% |
| May | $1,091,525.58 | $1,126,738.17 | $1,309,510.42 |
2006.3% |
| June | $1,127,891.50 | $1,163,463 | $1,349,191.50 |
2070.1% |
| July | $1,164,257.42 | $1,200,187.83 | $1,388,872.58 |
2133.9% |
| August | $1,200,623.33 | $1,236,912.67 | $1,428,553.67 |
2197.7% |
| September | $1,236,989.25 | $1,273,637.50 | $1,468,234.75 |
2261.6% |
| October | $1,273,355.17 | $1,310,362.33 | $1,507,915.83 |
2325.4% |
| November | $1,309,721.08 | $1,347,087.17 | $1,547,596.92 |
2389.2% |
| December | $1,346,087 | $1,383,812 | $1,587,278 |
2453% |
| All Time | $1,146,074.46 | $1,181,825.42 | $1,369,032.04 |
2102% |
| January | $1,387,378.67 | $1,426,572.58 | $1,647,465.92 |
2549.9% |
| February | $1,428,670.33 | $1,469,333.17 | $1,707,653.83 |
2646.7% |
| March | $1,469,962 | $1,512,093.75 | $1,767,841.75 |
2743.5% |
| April | $1,511,253.67 | $1,554,854.33 | $1,828,029.67 |
2840.3% |
| May | $1,552,545.33 | $1,597,614.92 | $1,888,217.58 |
2937.1% |
| June | $1,593,837 | $1,640,375.50 | $1,948,405.50 |
3033.9% |
| July | $1,635,128.67 | $1,683,136.08 | $2,008,593.42 |
3130.7% |
| August | $1,676,420.33 | $1,725,896.67 | $2,068,781.33 |
3227.5% |
| September | $1,717,712 | $1,768,657.25 | $2,128,969.25 |
3324.3% |
| October | $1,759,003.67 | $1,811,417.83 | $2,189,157.17 |
3421.1% |
| November | $1,800,295.33 | $1,854,178.42 | $2,249,345.08 |
3517.9% |
| December | $1,841,587 | $1,896,939 | $2,309,533 |
3614.7% |
| All Time | $1,614,482.83 | $1,661,755.79 | $1,978,499.46 |
3082.3% |
| January | $1,912,592.58 | $1,975,978.17 | $2,362,093.25 |
3699.3% |
| February | $1,983,598.17 | $2,055,017.33 | $2,414,653.50 |
3783.8% |
| March | $2,054,603.75 | $2,134,056.50 | $2,467,213.75 |
3868.4% |
| April | $2,125,609.33 | $2,213,095.67 | $2,519,774 |
3952.9% |
| May | $2,196,614.92 | $2,292,134.83 | $2,572,334.25 |
4037.4% |
| June | $2,267,620.50 | $2,371,174 | $2,624,894.50 |
4122% |
| July | $2,338,626.08 | $2,450,213.17 | $2,677,454.75 |
4206.5% |
| August | $2,409,631.67 | $2,529,252.33 | $2,730,015 |
4291.1% |
| September | $2,480,637.25 | $2,608,291.50 | $2,782,575.25 |
4375.6% |
| October | $2,551,642.83 | $2,687,330.67 | $2,835,135.50 |
4460.1% |
| November | $2,622,648.42 | $2,766,369.83 | $2,887,695.75 |
4544.7% |
| December | $2,693,654 | $2,845,409 | $2,940,256 |
4629.2% |
| All Time | $2,303,123.29 | $2,410,693.58 | $2,651,174.63 |
4164.3% |
| January | $2,753,723.75 | $2,916,544.25 | $3,019,295.17 |
4756.4% |
| February | $2,813,793.50 | $2,987,679.50 | $3,098,334.33 |
4883.5% |
| March | $2,873,863.25 | $3,058,814.75 | $3,177,373.50 |
5010.6% |
| April | $2,933,933 | $3,129,950 | $3,256,412.67 |
5137.7% |
| May | $2,994,002.75 | $3,201,085.25 | $3,335,451.83 |
5264.9% |
| June | $3,054,072.50 | $3,272,220.50 | $3,414,491 |
5392% |
| July | $3,114,142.25 | $3,343,355.75 | $3,493,530.17 |
5519.1% |
| August | $3,174,212 | $3,414,491 | $3,572,569.33 |
5646.3% |
| September | $3,234,281.75 | $3,485,626.25 | $3,651,608.50 |
5773.4% |
| October | $3,294,351.50 | $3,556,761.50 | $3,730,647.67 |
5900.5% |
| November | $3,354,421.25 | $3,627,896.75 | $3,809,686.83 |
6027.7% |
| December | $3,414,491 | $3,699,032 | $3,888,726 |
6154.8% |
| All Time | $3,084,107.38 | $3,307,788.13 | $3,454,010.58 |
5455.6% |
Between 2023 and 2050, Bitcoin price forecast hints at a massive expansion in the six-digit territory. The average price of BTC in 2050 could be between $2.9 million and $3.3 million. Investors should take these long-term forecasts with a grain of salt and also consider that these forecasts are bound to change depending on the developments at the time.
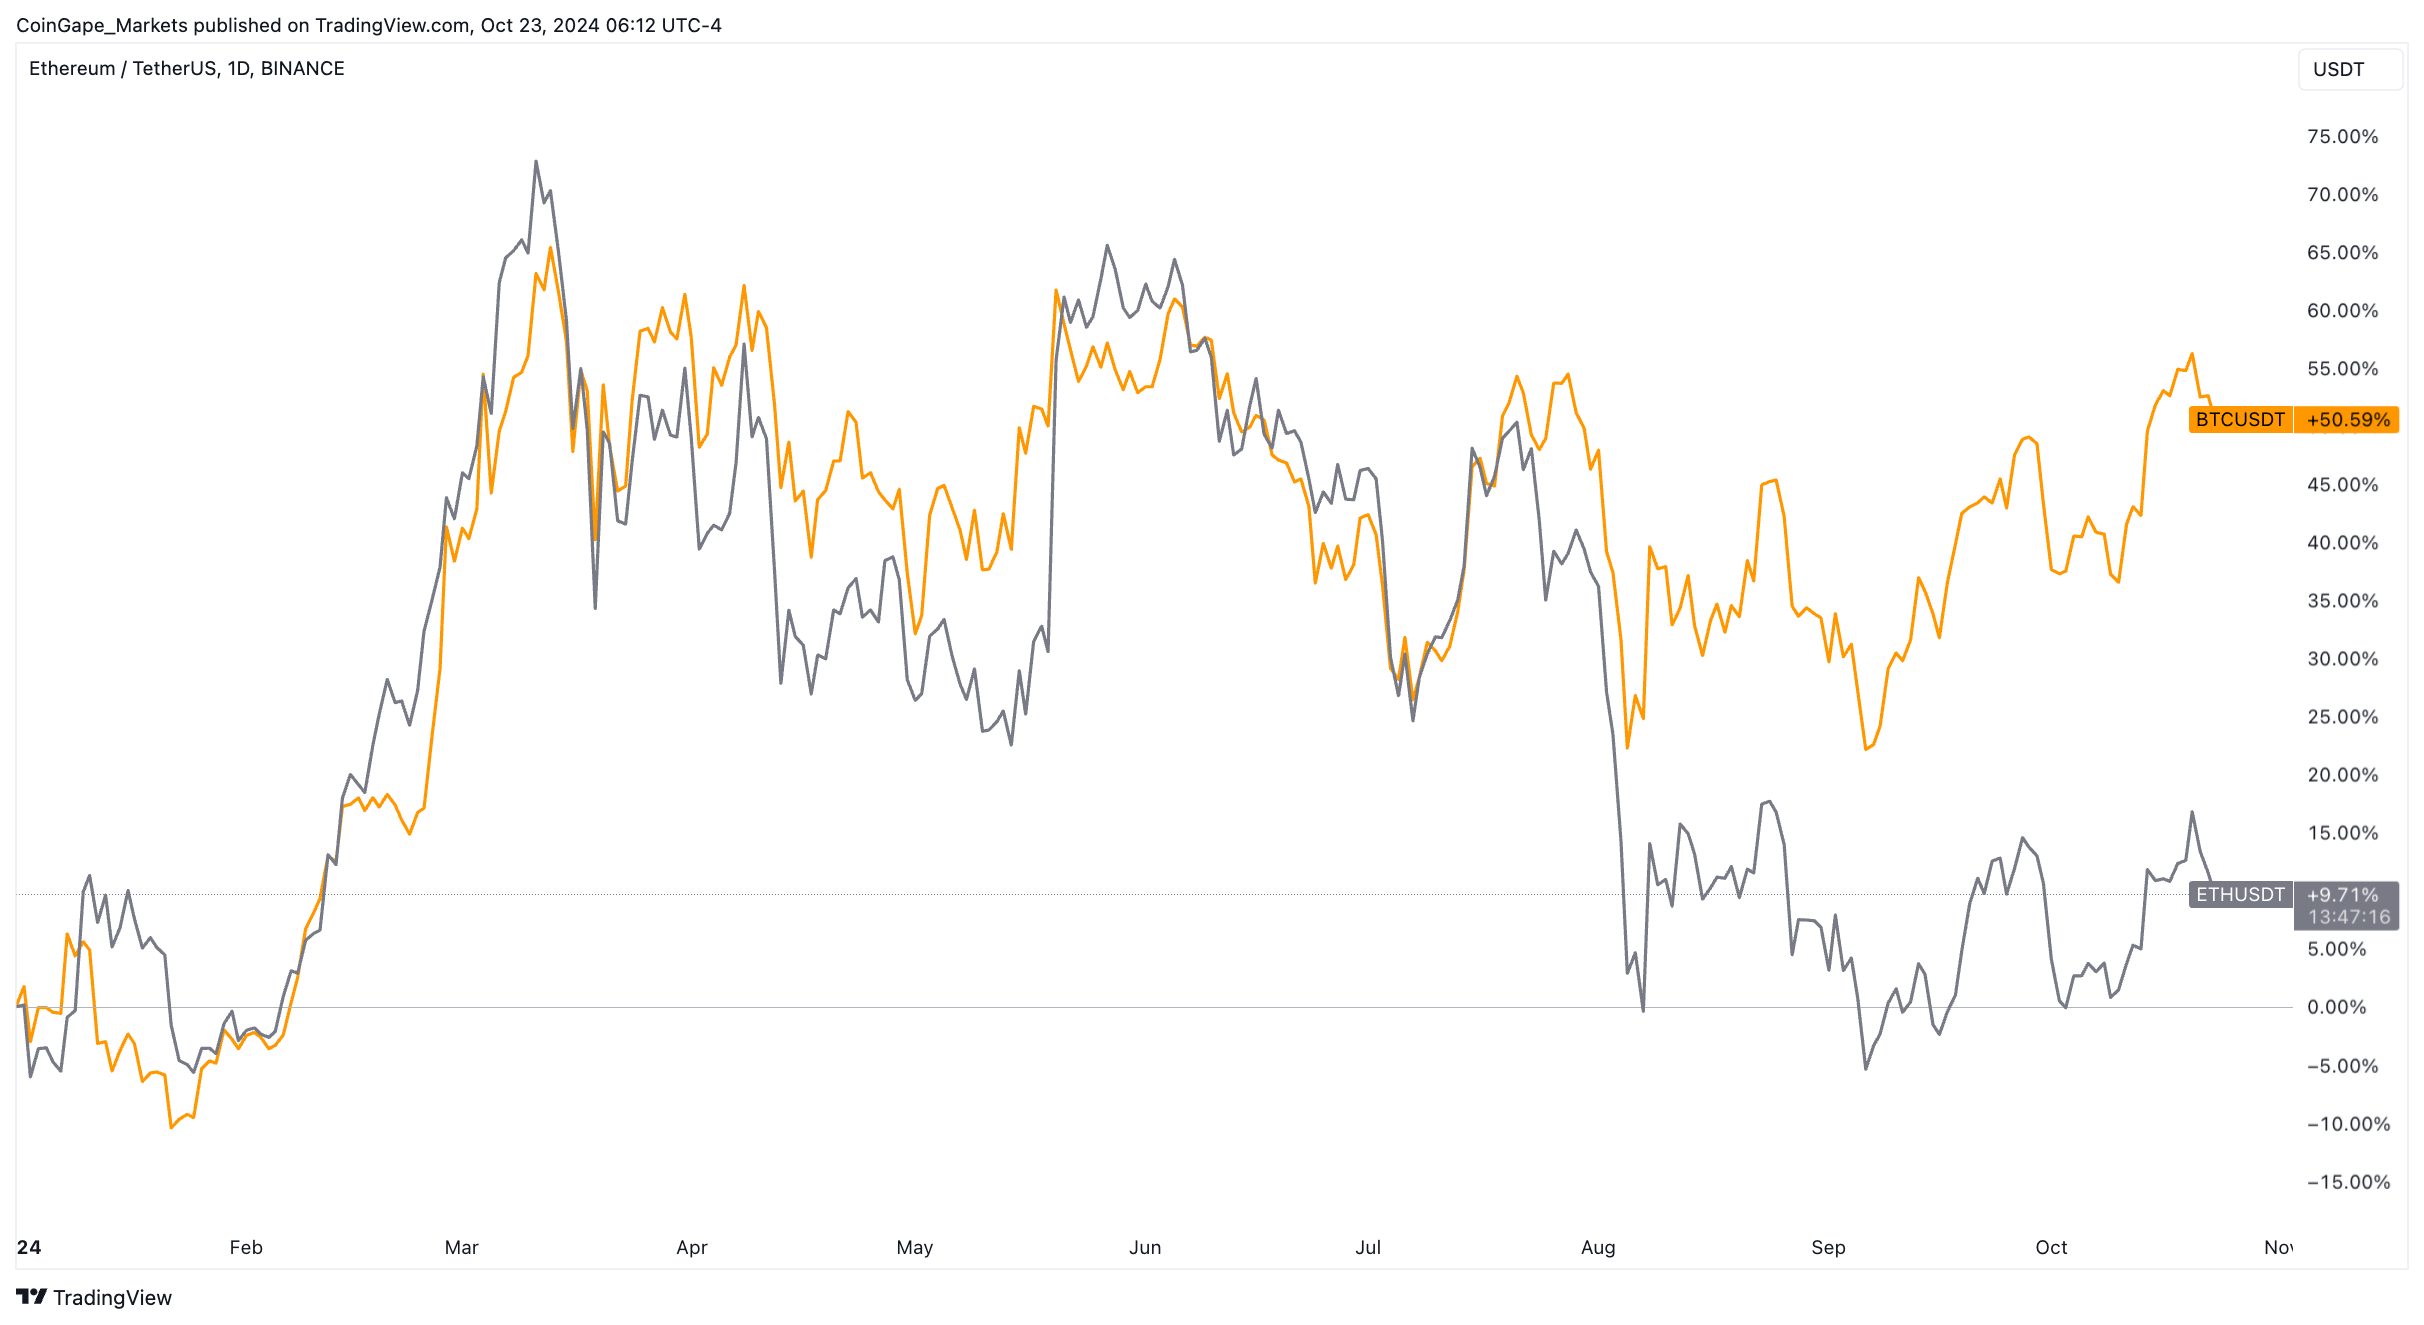
Bitcoin price performance vs. Ethereum price performance
Bitcoin has maintained a strong lead against ETH with a year-to-date return of 52%, while Ethereum price sits at 12%.
BTC vs ETH Price YTD Performance
This outlook, where BTC dominates ETH and the rest of the crypto market, will likely continue as the bull run kickstarts.
Bitcoin ETFs Impact on Bull Run
After the launch of spot Bitcoin ETF, there was a lot of outflow initially, which seemed bearish at first. However, the outlook has changed drastically since then. The cumulative Bitcoin ETF flows currently sit at a whopping $21.15 billion.
Due to the consolidation nature of the markets awaiting the conclusion of the US presidential elections, the effect of institutions buying BTC has not yet been felt. If traditional investors continue their buying spree, it could create a negative supply shock, which could trigger a massive bull run.
 Spot Ethereum ETF
Tuesday, October 22, saw a net outflow of -$79.09 million, as seen in the chart above.
Images are for reference only.Images and contents gathered automatic from google or 3rd party sources.All rights on the images and contents are with their legal original owners.
Aggregated From –
Comments are closed.