Our Terms & Conditions | Our Privacy Policy
Satellite images reveal the total collapse of the Conger-Glenzer ice shelf in East Antarctica
Australian and international scientists have used satellite imagery to chronicle the collapse of a New York City-sized ice shelf in Antarctica, shedding light on key processes linked to future sea level rise.
Since the mid-1990s, about 10 ice shelves have been observed rapidly disintegrating in West Antarctica and the Antarctic Peninsula.
But two years ago, scientists documented a similar event taking place in East Antarctica — an area previously considered far more stable.
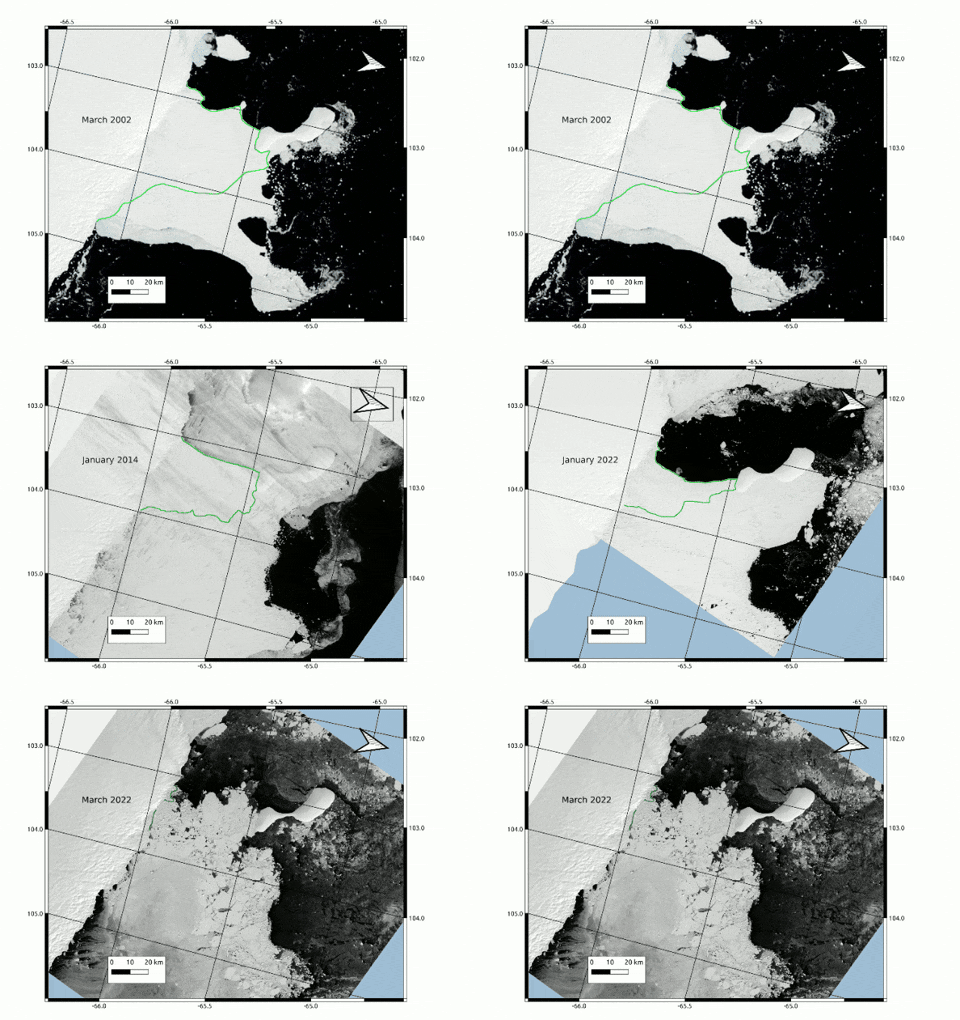
The Conger-Glenzer ice shelf (marked by green line) disintegration documented between March 2002 and March 2022. (Supplied: US Geological Survey)
“Strikingly, in 2022, during an observation campaign over a neighbouring ice shelf in East Antarctica, we noticed that the Conger-Glenzer ice shelf — about 1,200 square kilometres — suddenly disappeared over just a few days’ time,” associate scientist Catherine Walker said in a post on Springer Nature.
Ice shelves surround large parts of the Antarctic coastline, acting like “buttresses” that protect the continental ice sheet, which scientists say holds about 58 metres of potential sea level rise if it were to fully melt.
The Shackleton Ice Shelf included the Conger-Glenzer Ice Shelf before it collapsed. (Supplied: Sarah Thompson)
“However, when ice shelves thin, retreat, fracture, and crevasse, their buttressing capabilities are diminished,” she stated.
“And like a crumbly cork, [they] let more and more of the ice sheet behind them flow out into the ocean, adding to sea level rise.”
Dr Walker, from the United States-based Woods Hole Oceanographic Institution, is the lead author of a new report into the collapse of the Conger-Glenzer ice shelf.
The study, which has been published in Nature Geoscience, involved several other scientists, including two members of the Australian Antarctic Program Partnership.
Satellite imagery reveals four stages before collapse
The team has documented four distinct stages in the ice shelf’s “evolution” after analysing 25 years of satellite imagery and other data.
Initially, small chunks began to break off, resulting in Conger-Glenzer’s separation from the Shackleton Ice Shelf between 1997 and 2000.
Over the following decade, Conger-Glenzer’s surface area reduced by about 10 per cent.
Thinning continued at a slightly slower rate until 2019, before it accelerated again until March 2022, when an extreme weather event hit the area.
Conger-Glenzer in 2002. (Supplied: US Geological Survey)
A satellite image of Gonger-Glenzer in 2022. (Supplied: US Geological Survey)
“In its weakened state, an unprecedented atmospheric river made landfall nearby in March 2022, bringing with it strong winds and large ocean swells,” Dr Walker stated.
“While the storm didn’t cause the collapse, its approach did hasten Conger-Glenzer’s demise, with the 1,200 square kilometre ice shelf disintegrating over a few days before the height of the storm.”
Dr Walker said Conger-Glenzer was a relatively small ice shelf by Antarctic standards, but its collapse has significant consequences.
“Long considered more stable than the West Antarctic Ice Sheet, this event added an exclamation point to the accelerating narrative of unexpected changes being observed in East Antarctica,” she said.
“What’s more, the collapse was driven by ocean-induced thinning and structural weakening rather than by surface melt.”
She said this raised the spectre of ice shelf collapse in other locations not susceptible to surface melt.
“In this way, Conger-Glenzer’s collapse serves as a small example of how to observe future changes and highlights our evolving understanding of early warning indicators for potential ice shelf collapse in the future,” she said.
Loading…
Images are for reference only.Images and contents gathered automatic from google or 3rd party sources.All rights on the images and contents are with their legal original owners.


Comments are closed.