Our Terms & Conditions | Our Privacy Policy
Time to watch the Metal Sector – Two stocks signalling a reversal – Stock Insights News
By Kiran Jani
The ongoing tariff war has made the metal sector highly volatile. Between October 2024 and January 2025, the Nifty Metal index declined by 23%. However, recent trends indicate a potential turnaround, with both the index and select stocks showing signs of recovery.
Hindalco Industries and JSW Steel have formed strong reversal patterns, suggesting possible upward movements. As these stocks approach key technical levels, they present potential trading opportunities.
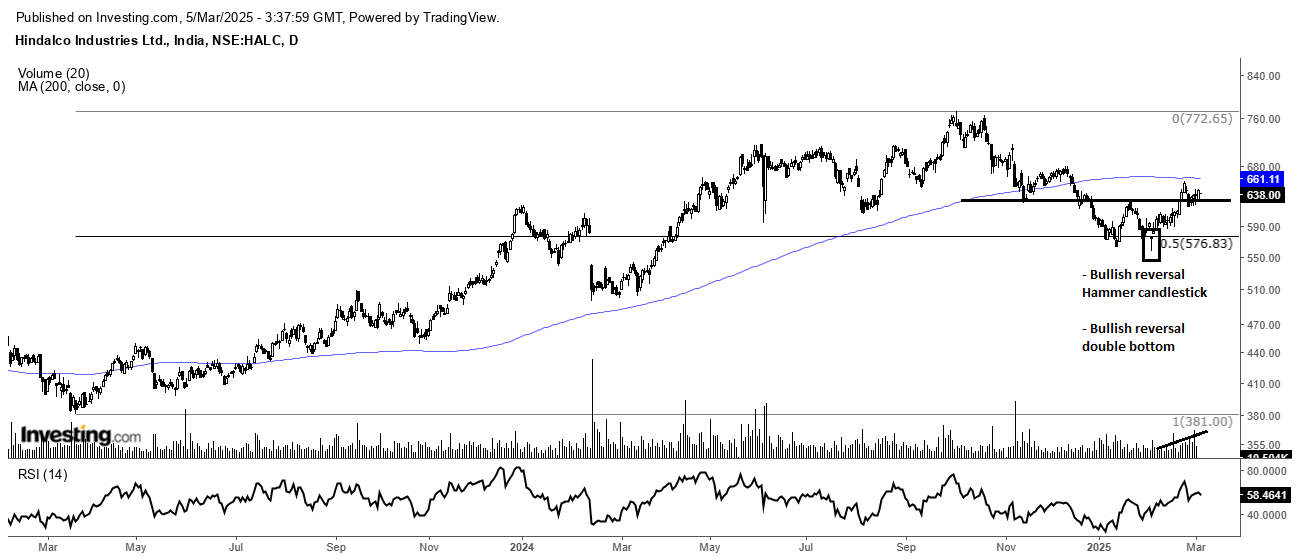
1. Hindalco Industries Limited – Signs of a Bullish Reversal
Hindalco experienced a 27% decline from its September 2024 peak of ₹772 to a low of ₹557. However, the stock price of Hindalco has rebounded from a strong long-term support level at ₹550, signalling renewed buying interest.
Why Hindalco Looks Promising:
- Bullish Reversal Candlestick Pattern – A classic bullish reversal pattern has emerged, often indicating a trend shift.
- Double Bottom Breakout – The stock has broken out of a short-term double-bottom pattern, reinforcing bullish sentiment.
- Fibonacci Retracement Support – Both the candlestick and double-bottom patterns align with the 50% Fibonacci retracement level, strengthening the reversal signal.
- Volume Surge – Increased trading volume reflects growing investor confidence.
- RSI Momentum – The 14-period RSI is above 60, showing bullish divergence, which may indicate further upside potential.
Source: Investing.com
Outlook: Hindalco Industries Limited
Hindalco has been a strong performer, delivering an impressive 100% return from March 2023 to September 2024. However, the stock entered a corrective phase, declining from ₹772 to ₹557 over the past six months.
Now, signs of a potential recovery are emerging. Hindalco has formed a bullish reversal candlestick pattern and displays a double-bottom structure—often a signal of accumulation before an upward move. These technical patterns suggest that the stock could be poised for a rebound.
2. JSW Steel – Bullish Continuation in Play
JSW Steel performed well in 2024, delivering a 62% return before pulling back from its September high of ₹1,060. However, the daily chart now flashes bullish signals, indicating the potential for another upward move.
Key Technical Indicators:
- Cup and Handle Breakout – A classic bullish continuation pattern has formed, suggesting a potential trend reversal.
- Price Above 200-SMA & Long-Term Rising Trendline—The stock has been trading above its 200-day Simple Moving Average and maintaining an upward trendline since May 2024, reinforcing a bullish outlook.
- RSI Showing Strength – The 14-period RSI is above 55, indicating strengthening momentum.
 Source: Investing.com
Outlook: JSW Steel – Signs of a Bullish Continuation
The past six months (August 2024 to January 2025) have been challenging for JSW Steel. The stock price of JSW Steel corrected from ₹1,060 to ₹880. However, recent technical signals suggest a potential turnaround.
JSW Steel is trading above its 200-day moving average (DMA). It has formed a bullish continuation cup and handle pattern—typically a sign of accumulation and a potential continuation of the previous uptrend. Adding to the bullish setup, the 14-period RSI has moved into the bullish zone, indicating strengthening momentum.
Final Take
With strong reversal signals, Hindalco and JSW Steel show signs of a potential comeback. Their bullish chart patterns, rising RSI, and key technical breakouts suggest momentum is building. While market volatility persists, these stocks could present attractive upside opportunities. Keep an eye on key resistance levels and confirmation signals—the next move could be just around the corner.
Disclaimer:
Note: The purpose of this article is only to share interesting charts, data points and thought-provoking opinions. It is NOT a recommendation. If you wish to consider an investment, you are strongly advised to consult your advisor. This article is strictly for educative purposes only.
As per SEBI guidelines, the writer and his dependents may or may not hold the stocks/commodities/cryptos/any other assets discussed here. However, clients of Jainam Broking Limited may or may not own these securities.
Kiran Jani has over 15 years of experience as a trader and technical analyst in India’s financial markets. He is a well-known face on the business channels as Market Experts and has worked with Asit C Mehta, Kotak Commodities, and Axis Securities. Presently, he is Head of the Technical and Derivative Research Desk at Jainam Broking Limited.
Disclosure: The writer and his dependents do not hold the stocks discussed here. However, clients of Jainam Broking Limited may or may not own these securities.
The website managers, its employee(s), and contributors/writers/authors of articles have or may have an outstanding buy or sell position or holding in the securities, options on securities or other related investments of issuers and/or companies discussed therein. The content of the articles and the interpretation of data are solely the personal views of the contributors/ writers/authors. Investors must make their own investment decisions based on their specific objectives and resources, and only after consulting such independent advisors if necessary.
[ad_1]
Images are for reference only.Images and contents gathered automatic from google or 3rd party sources.All rights on the images and contents are with their legal original owners.
Aggregated From –
[ad_2]
Comments are closed.