Our Terms & Conditions | Our Privacy Policy
Scientists unveil results of full-year analysis on building-integrated photovoltaics – pv magazine International
Scientists from Denmark have examined three façades installed on a mobile office container to conduct building-integrated PV experiments.
October 25, 2024
Lior Kahana
Researchers from the Technical University of Denmark (DTU) constructed a building-integrated photovoltaics (BIPV) test site and monitored it for a year to analyze the yields of different types of panels. They focused on BIPVs with different colors and rear ventilation configurations. The test site also included a section with differently structured front glass and a module with back-contact (IBC) cells, the results of which will be published at a later date.
“The base structure consists of a mobile office container with a footprint of circa 3 m × 9 m. Subsequently, prefabricated curtain wall elements consisting of an aluminum frame with 200 mm of mineral wool insulation were mounted as the outer wall,” explained the researchers. “On elements where PV modules are mounted with rear ventilation, a thin fiber cement plate provides wind and weather protection for the insulation material. Non-ventilated PV modules are mounted directly touching the insulation as a rain screen, fixed with aluminum frames integrated into the curtain wall structure.”
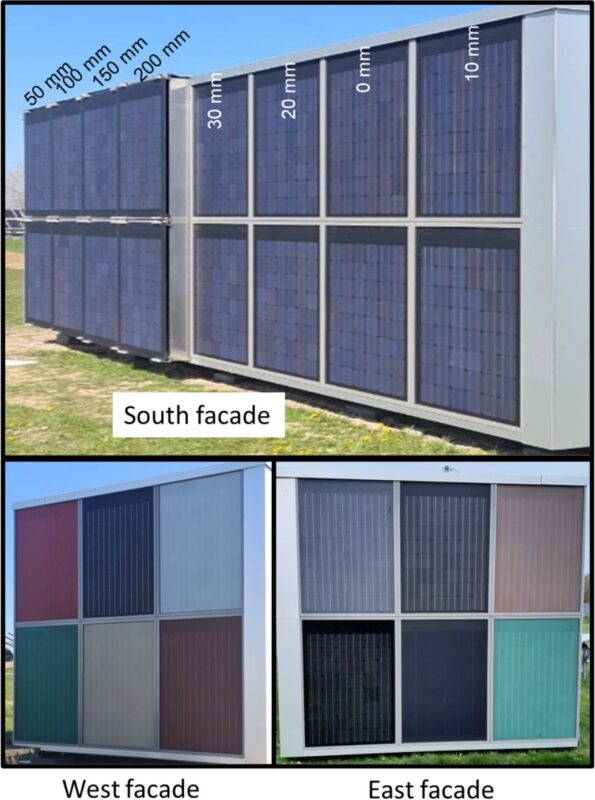
On the south side of the container, 16 uncolored modules were mounted to test the ventilation effect. For the modules without rear ventilation, the distance to the insulation varied between 0, 10, 20, and 30 mm. The modules with rear ventilation were mounted on horizontal brackets, with air gaps of 50, 100, 150, and 200 mm for natural rear ventilation.
The 3 façades
Image: Technical University of Denmark,Energy and Buildings, CC BY 4.0
On the west façade, five differently colored modules and a reference module were mounted without an air gap. For them, pigment-based colored interlayers were laminated with an additional encapsulant layer between the cell matrix and the front glass. The colors used were red, gray, green, beige, and terracotta. The panels were monitored between September 1, 2022, and August 30, 2023.
 The monthly error between modeled and measured DC power
Image: Technical University of Denmark,Energy and Buildings, CC BY 4.0
“On the west façade, the reference and green modules have the lowest annual DC performance ratios (PRs) of 0.86, the grey, beige, and terracotta have slightly higher annual DC PRs of 0.88 to 0.89 while the red module has a considerably higher annual DC PR of 0.95,” said the academics. “The higher PR for the red module may in part be attributed to spectral mismatch gains in the afternoon, which can amount to up to 10% in the evening.”
An analysis of operating temperatures for the south façade showed a 40% to 50% lower temperature difference to ambient for externally mounted modules with rear ventilation compared to insulated modules. The annual performance ratio of the better-ventilated modules was found to be 6% pt higher on average.
After obtaining the results from the ventilated and unventilated sides of the container, the same façade was simulated in the National Renewable Energy Laboratory’s (NREL’s) System Advisor Model (SAM) in an attempt to identify errors in the models that contract this software. “Four scenarios are simulated using data from modules S2 (insulated top), S6 (insulated bottom), S9 (200 mm airgap top), and S13 (200 mm airgap bottom) as they represent the most extreme mounting configurations for both the top and bottom rows,” they explained.
The results showed decent agreement between modeled and measured data for irradiance, except for some periods in the morning and evening.
“Regarding the operating temperatures, SAM is able to predict the temperature of ventilated modules quite well on clear sky days, however for insulated modules the modeled temperature can be around 10 K lower than measured,” they concluded. “On intermittently cloudy days, the model performs significantly worse, though the transient thermal model correction in SAM does reduce the error. Finally for DC yield, a general overestimation by SAM was noticed, which is significantly higher in winter months compared to summer months.”
Their findings were presented in “Yield analysis of a BIPV façade prototype installation,” published in Energy & Buildings. The underlying data set is published for researchers to use in model validation.
This content is protected by copyright and may not be reused. If you want to cooperate with us and would like to reuse some of our content, please contact: editors@pv-magazine.com.
Popular content

Images are for reference only.Images and contents gathered automatic from google or 3rd party sources.All rights on the images and contents are with their legal original owners.
Aggregated From –
Comments are closed.