Our Terms & Conditions | Our Privacy Policy
Recent on-chain data has shown that Bitcoin might be entering into two separate crucial phases in the current market cycle that could help to determine the next trajectory of the crypto asset’s price over the coming weeks.
Bitcoin’s Accumulation And Distribution Phases Identified
Bitcoin’s capital flow on the blockchain is revealing regions of Accumulation and Distribution, providing insight into investors’ behavior as reported by Alphractal, an advanced investment data platform, in a recent post on the X (formerly Twitter) platform.
It is worth noting that during accumulation phases whales and long-term investors tend to grow their Bitcoin holdings, which are characterized by high activity and an indication of confidence in the asset’s price growth in the future. Meanwhile, during distribution phases, these holders sell off a percentage of their holdings, mostly leading to market corrections and heightened market volatility.
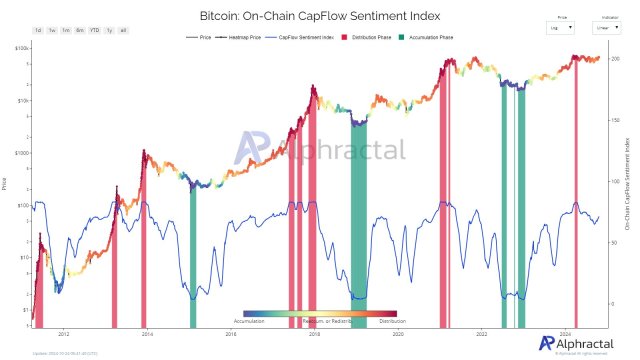
The platform developed the prognosis after examining Bitcoin’s On-chain CapFlow Sentiment Index metric. This key metric assesses the realized capitalization of BTC by using a combination of momentum and stochastic indicators, along with a number of on-chain oscillators.
On-chain data showing two phases for Bitcoin | Source: Alphractal on X
According to the platform, the indicator has been reliable in pinpointing the areas in the network, where the momentum of coin flow starts to wane and lose steam, reflecting distribution by smart hands. Alphractal claims this particular development also occurs during accumulation phases, which corresponds with local bottoms.
Furthermore, the platform noted that after a distribution period in 2024, Bitcoin has yet to reach new all-time highs. However, there is a possibility that something akin to what took place in 2017, where three phases were cited might happen again.
As a result, Alphractal has underscored the importance of keeping an eye on the metric and assessing whether fresh demand is developing, as a contrary development will signal a drop in the metric, potentially causing the price of BTC to go down.
BTC Regaining Its Lost Momentum Once Again?
With several positive advancements in Bitcoin’s on-chain activity and metrics, there is potential for the crypto asset to regain its previous upward momentum, in which BTC surged from the $59,000 level to nearly $70,000 in the past week.
BTC experienced an uptick to about $68,693 late Thursday. However, as of today, the crypto asset has dropped below $67,500. Although this movement may have sparked concerns, Bitcoin is displaying resiliency, holding strong at the $67,300 support level.
The brief drop might be due to the absence of bulls, as identified by a decline in trading volume, which has dropped over 11% in the past day. In the event that bulls take back control of the market, BTC could amass enough strength for a price recovery, with the $70,000 level as one of the next key areas to watch out for.

Featured image from Unsplash, chart from Tradingview.com
Images are for reference only.Images and contents gathered automatic from google or 3rd party sources.All rights on the images and contents are with their legal original owners.
Aggregated From –
Comments are closed.