Our Terms & Conditions | Our Privacy Policy
Without data about number of units of products sold and average price at which such products are sold, it is hard to have intelligent conversations about whether NVIDIA’s $2.9 trillion valuation is justified or not.
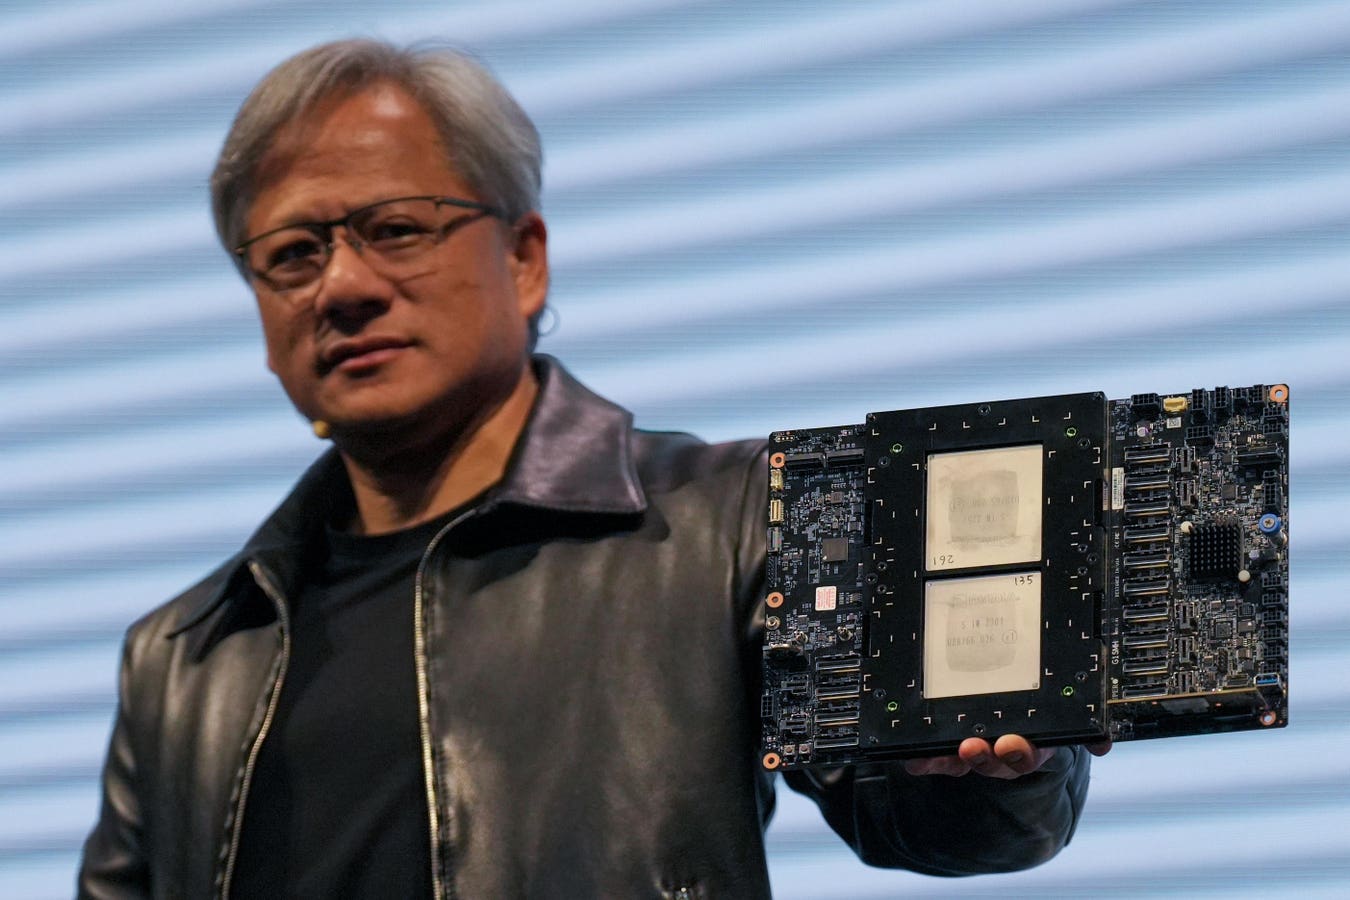
TAIPEI, TAIWAN – 2023/06/01: Jensen Huang, President of NVIDIA holding the Grace hopper superchip … [+] CPU used for generative AI at supermicro keynote presentation during the COMPUTEX 2023. The COMPUTEX 2023 runs from 30 May to 02 June 2023 and gathers over 1,000 exhibitors from 26 different countries with 3000 booths to display their latest products and to sign orders with foreign buyers. (Photo by Walid Berrazeg/SOPA Images/LightRocket via Getty Images)
SOPA Images/LightRocket via Getty Images
This semester, we discuss NVIDIA as our live case in my class. An important analytical tool that we usually ask students to think about is to decompose a firm’s revenue into quantity of product sold (Q), the product mix sold (M), the selling price per unit of the product (P) and any foreign currency impact (FX). The roots of this thinking go back to some of the Apples-to-Apples work conducted by Trevor Harris at Morgan Stanley in the late 90s and early 2000s.
Why decompose revenue this way? I often tell students that Q is among the best ways to ground the company’s valuation into a strategic plan for management.
Netflix Q
To illustrate this point, consider a simple example. Ignore M and FX for now. As of 9/16/2024, Netflix trades at $702 a share. In the year just ended, Netflix reported an annual EPS (earnings per share) of $12.03. Assuming a cost of equity capital of roughly 9% (treasury bill yield of 3.65%, beta of 1.1, assuming a risk premium of 5%), Netflix’s earnings per share earned till perpetuity would amount to $133 ($12.03/0.09). This simple calculation suggests that Netflix needs to earn $58.2 more in earnings per share in the future [($702-133) = $569*.09]. This translates approximately to $23 billion more in annual income every year (450 million shares*$51). Now, bring this back to Q. Netflix reported 278 million paying subscribers as of July 2024. This suggests that the company will have to generate $83 in additional profit every year from every subscriber ($23 billion/278 million subscribers). That’s $83 in income not revenue or roughly $7 per month in profit. Is that feasible, given that the US and Canadian market (roughly 76 million subscribers) is likely saturated and likely the only ones most insensitive to price increases?
The bigger point is that one can at least have strategic conversations, grounded in data, regarding Netflix’s valuation. Most analyst and board room conversations tend to center around growth rate in earnings (g). I find abstract comments about growth rate (g) embedded in valuation somewhat useless. How do I calibrate g? What does that mean for Netflix’s strategy or the possibility that they will hit that growth rate? Conversations about Q are far more insightful to me.
So, what does this have to do with NVIDIA?
NVIDIA
Well, NVIDIA does not disclose Q and P. Consider the data. As of 9/16/2024, NVIDIA trades at $118 per share. I usually benchmark this to EPS from last year, but NVIDIA is a special case because their revenue in the first two quarters this year is as high as the revenue for all of last year. The cumulative EPS for the first half of this year is $1.29. Let’s simply extrapolate this to the year ($2.60). Assuming a cost of equity capital around 13% (treasury bill yield of 3.65%, beta of 1.8, assuming a risk premium of 5%), we are looking at $20 per share as the value of repeating this year’s forecasted EPS forever ($2.6/0.13). This suggests that NVIDIA will need to earn an additional $12.74 ($118-$20 = $98*.13) or essentially increase EPS by six times of this year’s income. Is that feasible?
I then look for Q and P and come back emptyhanded. NVIDIA has three fast growing segments (Data Center segment, Networking segment and the Automotive segment) and two steady segments (Gaming and Visualization). Here is NVIDIA’s disclosure in its latest 10-K that comes the closest to being useful.
Revenue for fiscal year 2024 was $60.9 billion, up 126% from a year ago. Data Center revenue for fiscal year 2024 was up 217%. Strong demand was driven by enterprise software and consumer internet applications, and multiple industry verticals including automotive, financial services, and healthcare. Customers across industry verticals access NVIDIA AI infrastructure both through the cloud and on-premises. Data Center compute revenue was up 244% in the fiscal year. Networking revenue was up 133% in the fiscal year. Gaming revenue for fiscal year 2024 was up 15%. The increase reflects higher sell-in to partners following the normalization of channel inventory levels and growing demand. Professional Visualization revenue for fiscal year 2024 was up 1%. Automotive revenue for the fiscal year 2024 was up 21%. The increase primarily reflected growth in self-driving platforms.
Unfortunately, there is no conversation about how much Q and P does NVIDIA sell in even one major segment (data center). How many GPUs (graphical processing units) does NVIDIA sell? How many more does it need to sell to grow into its valuation? If your comeback is that it will do something else, please articulate what that something is and how much of P and Q of that something the company must sell? Without such data, it is hard to have intelligent conversations about whether NVIDIA’s $2.9 trillion valuation is justified or not.
Large sample evidence
In a recently completed paper, my co-authors (Sriniwas Mahapatro of the Rochester Institute of Technology, Prateek Manikpuri and Prasanna Tantri of the Indian School of Business) and I look at a natural experiment in India where manufacturing firms were required to disclose product-level revenues and quantities sold in audited financial statements from 1997-2011. We document that such mandated disclosure of quantities and product prices (i) reveal the persistence of sales growth of firms; (ii) reduce information asymmetry between the manager and the market; (iii) reduce analysts’ revenue forecast errors; and (iv) reduce the stock market reaction to earnings announcements.
The large sample evidence simply confirms the intuition that it is very difficult to bring back valuations to strategic conversations unless we know something about the firms’ P and Q. In particular, is the stock market’s assessment of NVIDIA’s future consistent with their plans on how much product and services to sell, how much to price the product and services, and what we might be assuming about competition or lack thereof or about the firm’s cost structure (e.g., fixed costs don’t change much as Q changes within a range). Concrete data on P and Q can move us from hypothetical guesswork to an evidence-based dialogue on the feasibility of NVIDIA growing into their valuation.
Comments welcome, as always.
Images are for reference only.Images and contents gathered automatic from google or 3rd party sources.All rights on the images and contents are with their legal original owners.
Aggregated From –
Comments are closed.