Our Terms & Conditions | Our Privacy Policy
(MENAFN- crypto Breaking)
While bitcoin ‘s price fluctuations often make headlines, the deeper narrative of BTC goes beyond mere speculation and technical analysis. On-chain data serves as a vital tool, providing exceptional insights into real-time supply, demand, and investor behaviors. By utilizing this data, traders and investors can forecast market trends, track institutional investments, and make informed, analytical decisions.
For a deeper dive into this subject, be sure to watch our recent YouTube video here: Mastering Bitcoin On-Chain Data
Realized Price & MVRV Z-Score
On-chain data encompasses the publicly accessible transaction details found on Bitcoin ‘s blockchain. In contrast to traditional financial markets, where investor behaviors often remain concealed, Bitcoin ‘s inherent transparency permits immediate evaluation of every transaction, wallet transfer, and network activity. This wealth of information enables investors to discern major trends, accumulation areas, and possible price turning points.
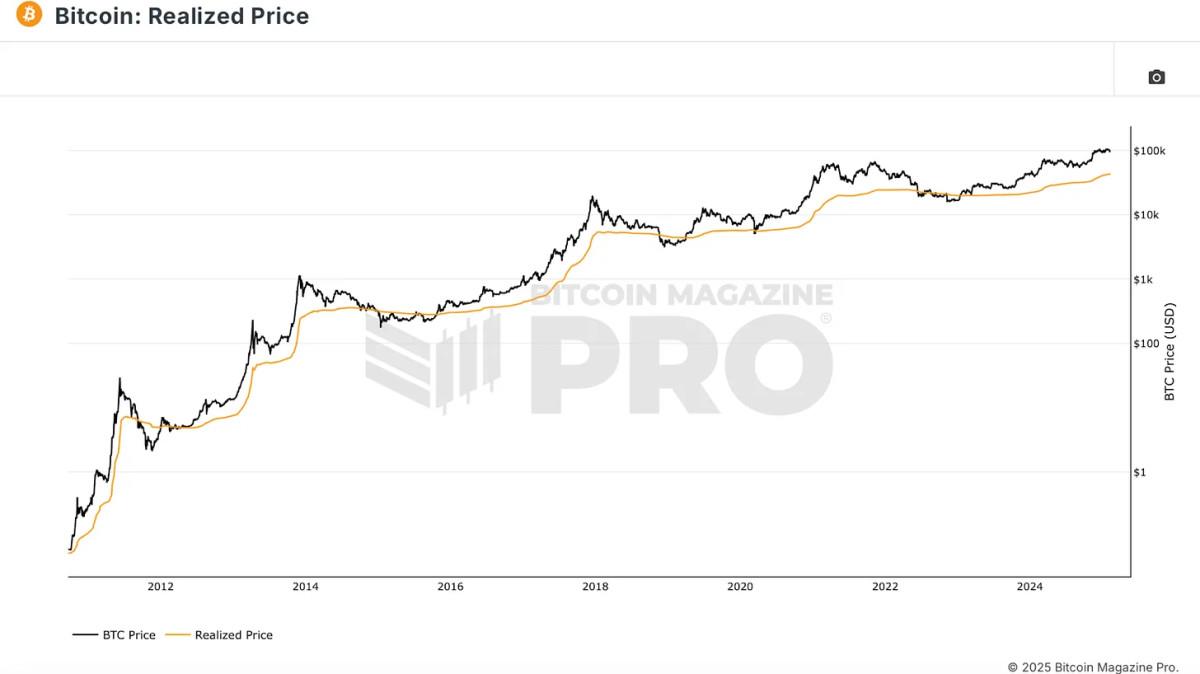
A pivotal on-chain metric is the Realized Price , which indicates the average cost basis for all circulating BTC . Unlike many conventional assets, where determining the cost basis for investors is challenging, Bitcoin offers real-time insights into the profitability status of the majority of holders.
Figure 1: Realized Price illustrates the cost basis for all BTC within the network.
View Live Chart
To further utilize the Realized Price, analysts apply the MVRV Z-Score . This metric evaluates the discrepancy between the market value and realized value, adjusted for Bitcoin ‘s inherent volatility. Historically, this indicator has pinpointed advantageous buying zones whenever it falls into the lower range and signals potential overvaluation when it reaches the upper threshold.

Figure 2: The MVRV Z-Score has historically detected market peaks and troughs.
View Live Chart
Tracking Long-Term Holders
Another significant metric is the 1+ Year HODL Wave , which monitors Bitcoin addresses that have not had any transactions for over a year. An increasing HODL wave indicates that investors are opting to hold their assets, thus decreasing the circulating supply and potentially exerting upward pressure on prices. Conversely, a declining metric suggests profit-taking and possible distribution.
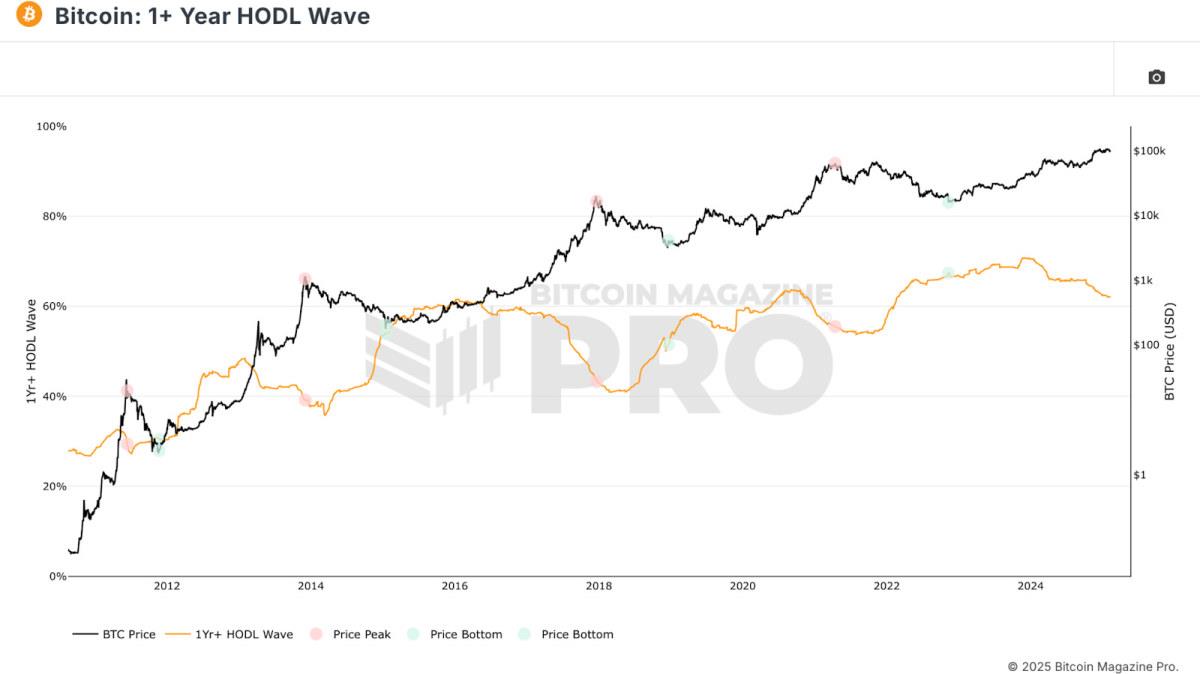
Figure 3: The 1+ Year HODL Wave displays the cyclical trends of BTC holders.
View Live Chart
HODL Waves illustrate the entirety of Bitcoin ownership distribution by duration. When filtering for newer market participants (those holding for 3 months or less), typical retail engagement levels can be observed. Peaks among short-term holders generally indicate market tops while lower levels signify optimal accumulation periods.

Figure 4: HODL Waves reveal when retail investors may be experiencing FOMO.
View Live Chart
Identifying Whale Activity
Supply Adjusted Coin Days Destroyed quantifies the total BTC that has moved, factoring in how long each coin was retained, and standardizing this data against the circulating supply at the time. For example:
-
1 BTC maintained for 100 days → 100 Coin Days Destroyed
0.1 BTC held for 1,000 days → 100 Coin Days Destroyed
This metric is essential for identifying whale movements and institutional profit realizations. Sudden movements of coins that have been idle for long periods often indicate significant holders liquidating their positions. Historical analyses demonstrate that surges in this data point correlate with major market peaks and troughs, emphasizing its usefulness in cycle evaluation.
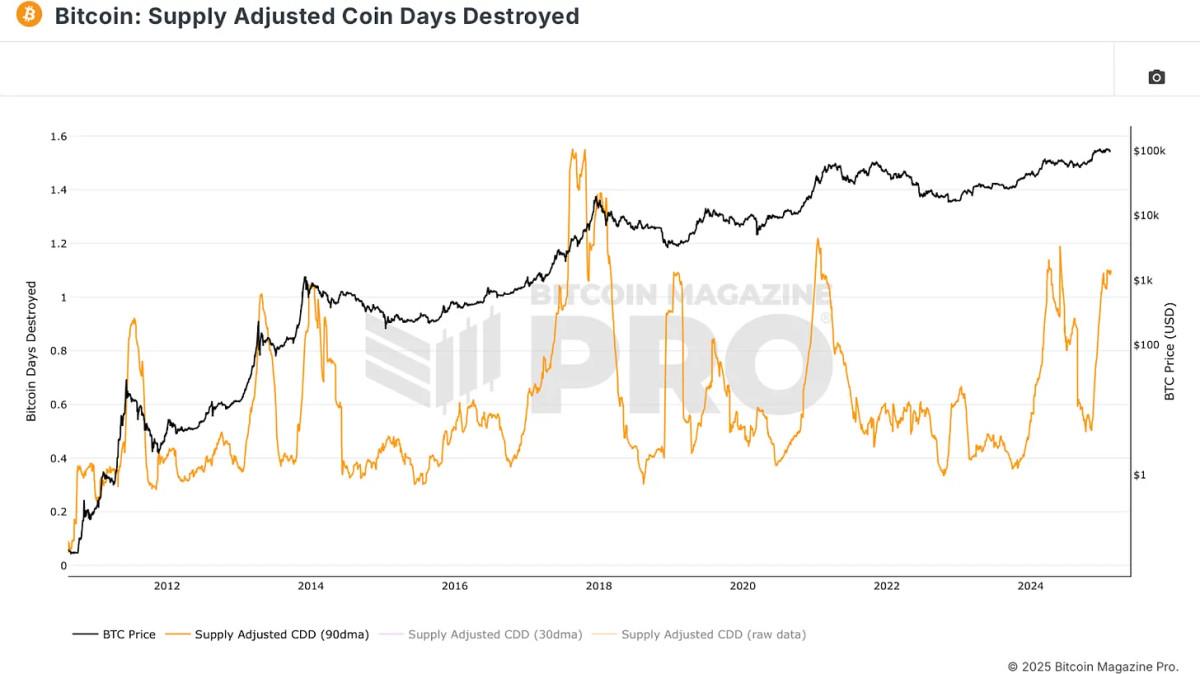
Figure 5: Supply Adjusted CDD indicates the activity levels of BTC transactions.
View Live Chart
Realized Gains & Losses
The Spent Output Profit Ratio (SOPR) indicates the profitability level of Bitcoin transactions. A SOPR above 0 denotes that the average Bitcoin being transacted is in profit, whereas a value below 0 indicates losses. By monitoring SOPR spikes, traders can spot instances of euphoric profit-taking, while declines in SOPR often coincide with bearish markets.

Figure 6: SOPR showcases real-time realizations of enthusiasm and capitulation.
View Live Chart
Focusing on a singular metric can lead to incorrect interpretations. To enhance the accuracy of signals, investors should look for agreement among multiple on-chain indicators.
As an illustration, when:
-
The MVRV Z-Score is in the undervalued zone (green)
SOPR indicates significant realized losses (capitulation)
HODL waves depict a reduction in short-term holders (selling exhaustion)
This convergence typically signifies prime accumulation opportunities. Similarly, it is wise to look for alignment when considering profit-taking from BTC holdings, seeking indicators that signal overheating market conditions.
Final Thoughts
On-chain data for Bitcoin offers a transparent, real-time perspective of market conditions, thereby equipping investors with an edge in their decision-making processes. By monitoring supply dynamics, investor sentiment, and cycles of accumulation and distribution, Bitcoin enthusiasts can better position themselves for enduring success.
Stay ahead of Bitcoin ‘s price movements by exploring live data, charts, indicators, and comprehensive research on Bitcoin Magazine Pro .
Disclaimer: This article is intended for informational purposes only and should not be regarded as financial advice. Always conduct thorough research before making any investment choices.
Crypto Investing Risk Warning
Crypto assets are highly volatile. Your capital is at risk.
Don’t invest unless you’re prepared to lose all the money you invest.
This is a high-risk investment, and you should not expect to be protected if something goes wrong.
MENAFN18022025008006017065ID1109220287
[ad_1]
Images are for reference only.Images and contents gathered automatic from google or 3rd party sources.All rights on the images and contents are with their legal original owners.
Aggregated From –
[ad_2]
Comments are closed.