
Health insurance got a major boost after the GST rate on premiums was cut to zero from 18 per cent, effective October 1. Insurers have already trimmed premiums by about 10-12 per cent, making coverage more affordable. Naturally, attention has centred on insurers — but what’s being overlooked is how hospitals could emerge as the next big beneficiaries of this reform. In developed markets, insurance is the key driver of healthcare access, and a similar model is now unfolding in India. As the insured base gradually expands, private hospitals stand to gain from a steady rise in patient inflows over the long term.
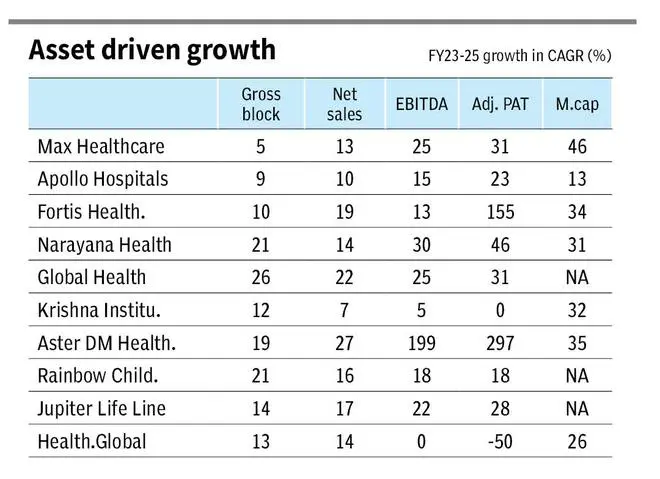
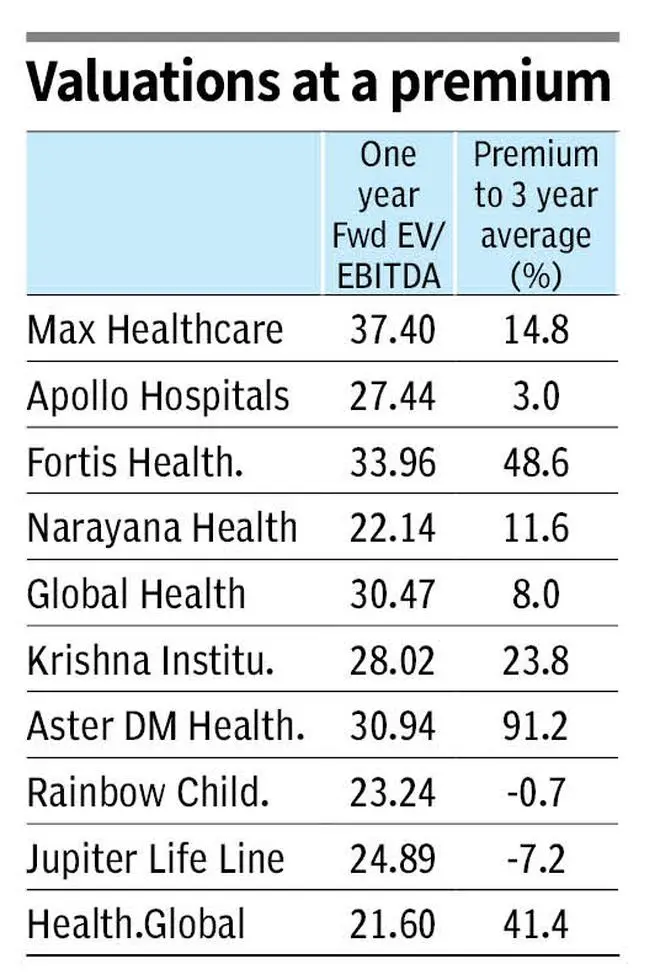
Several Indian investment professionals and more recently Professor Aswath Damodaran, popularly called the Dean of Valuation, have indicated the long-term potential of the hospital stocks. If history is any yardstick, hospital stocks have been a sweet pill for investors. Over the past three years, the top listed players have grown their market value by about 30 per cent annually, supported by roughly 60 per cent profit growth, as shown in the table. Despite this strong run and outperformance, we believe the growth story is far from over, though valuations will need close watching.
A closer look at industry metrics explains why investors remain optimistic. Expansion plans already under way point to sustained earnings growth over the next five years, if not more. For long-term holders, understanding these operating metrics is key to building conviction in the sector. Here’s a closer look at the underlying metrics.
Structural drivers
For hospitals, the two primary drivers — volume and price are favourable and should sustain in the longer term.
Healthcare delivery in India is increasingly becoming a private sector activity. Government hospitals’ share in treatments has decreased from 38 per cent in FY17 to 31 per cent in FY23, and is expected to decline further to 27 per cent by FY27, according to CRISIL Research.
On the other hand, State and Central government schemes account for 30-35 per cent of the hospital payor mix. This includes Ayushman Bharat scheme, which accounts for close to half of the ‘government’ category for many listed hospitals. That universal insurance scheme, launched in 2018, is gaining strong traction, despite reports of payment issues. Recently, the scheme has been expanded to individuals of 70+ years without income consideration as well. For the ‘missing middle’, GST revision boosts the prospects of healthcare coverage. The missing middle refers to the uninsured populace, who is not a beneficiary of government schemes and could not afford private health insurance.
Overall, State support through insurance is increasing with the burden of healthcare delivery increasingly shouldered by the private industry. This is the volume support for the industry which can play out over several years. As we will detail later, capital expansion of the private sector is taking off in a strong way. The hospital sector has utilised debt and capital markets to drive expansion. The stock universe has widened. Compared to the four large listed players in FY20, there are more than 10 large listed hospital players now. The institutional funding from marquee investors and international private equity (PE) funds has also backed the expansion supporting the volume growth of the industry. The industry leaders have maintained a RoCE of 20-25 per cent in FY25, indicating a strong runway for growth.
On the pricing front, even with modest low single-digit price hikes taken every year, the industry can drive a realisation growth of 6-7 per cent. This can be attributed to technology, acuity mix (therapy mix of patients) and operational efficiency, as will be detailed later.
Under-penetration, demographics and rising income levels are the secular support factors not only for healthcare, but for Indian economy on the whole. Within healthcare, the UN recommends three beds per 1,000 people. Four metros in India clear the mark (Mumbai, Chennai, Bengaluru and Hyderabad), with Delhi-NCR at 2.7. The lack of healthcare in tier-II cities is starker. The industry is responding to the demand with a significant portion of the expansion breaking into tier-II clusters for the next phase of expansion. The demographic factor includes not only the ageing population, but also the increasing incidence of lifestyle diseases of cancer, cardiovascular and diabetic therapies. The rising income levels allow the industry to adopt latest technologies in combating diseases and this adds to the industry growth levers.
Overall, the industry metrics point to a low double-digit topline growth over the years driven equally from volume and price with support from the secular drivers of the healthcare industry.
Next, we look at the finer nuances of industry metrics.
Price metrics
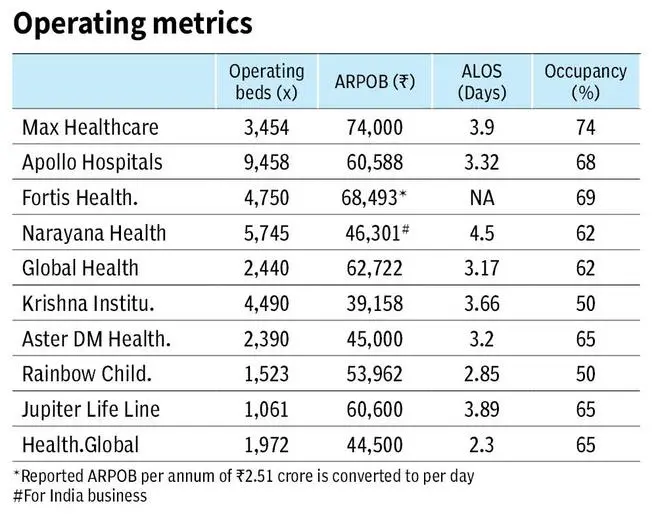
The primary price metric is ARPOB or Average Revenue Per Operating Bed. This metric includes the impact of three functions of a hospital. The efficiency and occupancy of a hospital, the case mix or the acuity mix, and finally the actual price hikes.
The actual price hikes are in low single-digits by most hospitals, taken once per year. Typically, ARPOB growth is higher than the price growth (10 per cent ARPOB CAGR for Apollo Hospitals since FY20) and is influenced more by the other two factors than the actual price hikes.
Occupancy and efficiency are pricing levers for the hospital industry. Mature hospitals operate at occupancy levels of 75 per cent. Mature hospitals are the ones with four-six years of operations or more depending on company definition. A newly-established hospital will take that time to establish its full capacity of space, personnel, procedures, technology, apart from the direct and indirect promotion of the hospital in the operating region. For instance, Global Health (Medanta) reports an ARPOB of ₹67,000 for mature hospitals (six years or more) and ₹54,000 for developing (less than six years). Legacy mix in a given financial year (new and mature hospitals in the portfolio) determines the ARPOB and the pace of growth. A portfolio with higher developing properties will have a lower but faster-growing ARPOB.
Efficiency is measured by ALOS or Average Length of Stay, which ranges around three days for the industry. Improvement in this measure can drive average realisations. As the patient turnaround time improves, the hospital asset is utilised further allowing for higher realisation from it. It can be generally expected that a 1 per cent lower ALOS can drive ARPOBs up by the same measure. Day-care procedures and technology are playing increasingly important role in improving ALOS. Few procedures that required in-patient hospitalisation earlier, can now be done in day-care procedures thereby improving the turnaround time. These include cataract, ENT, chemotherapy and the list expands with technology.
Robotic surgeries are driving pricing and turnaround times. Da Vinci surgical systems for urology, gynecology, cardiac and general surgery (cost of ₹15 crore), Linac systems for oncology surgeries (cost of ₹10-12 crore), TAVRs for cardiology are improving realisations and turnaround times for hospitals. Hence, they are being increasingly employed across the industry for efficiency and patient care.
Acuity mix is the other lever for pricing growth of hospitals. Oncology is amongst the fastest rising treatment in India and is increasing in proportion for all hospitals. Oncology, cardio, neurological and transplants are the high-end procedures. As a hospital matures in operations, its mix of higher-order treatments increase improving realisations from the facility. Rising incomes and wider insurance coverage are enabling patients to access higher-end treatments that were once prohibitively expensive.
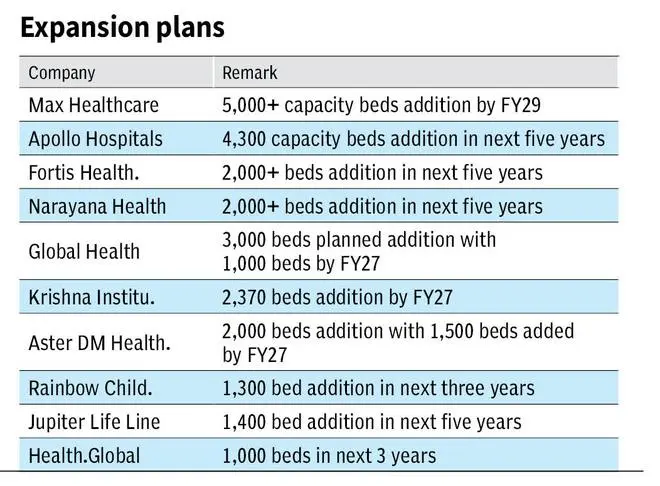
Capacity addition
The Indian hospital sector is looking to nearly double its existing capacity in the next five years. As shown in the table, the top-10 players are adding close to 24,000 beds in the next five years, which is a 65 per cent addition to their current capacity of 37,000 beds. On optimistic assumptions, this implies a volume CAGR of 10-11 per cent for the next five years, in addition to 6-7 per cent ARPOB growth for the industry. The players have delivered an average 16 per cent revenue CAGR in FY23-25 and appear to be gearing up to deliver a similar performance in the next five.
This round of expansion will include not only the existing clusters in Delhi-NCR, Mumbai, Chennai or other metros but will also expand to tier-II cities including Nagpur, Coimbatore, Patna or Ongole. While hospital portfolios with a rising non-metro share may see lower ARPOBs, their profitability, return ratios and overall growth should not be impacted.
Apollo Hospitals estimates that its metro hospitals has an average ARPOB of ₹74,000 compared to an ARPOB of ₹42,000 in non-metros. But the cost of development in a non-metro ranges from ₹50-60 lakh per bed, compared to the higher range of ₹1 crore per bed in metros. As the cost of land is a major part of the capex for a new hospital, the project cost in a non-metro can be halved which allows for a healthy return profile on the capital employed despite a lower ARPOB. Despite lower pricing, such expansions have proven to be profitable as seen in the case of Apollo Hospitals or KIMS being the prime example.
Brownfield vs greenfield is the other parameter that can influence cost of expansion. Projects that are developed on lands adjoining existing centres or in their vicinity not only face a lower cost but their gestation period can be shortened as the existing catchment area is readily available. Rainbow Hospitals’ entry into two centres in Chennai was a greenfield expansion in a newer geography may impact the gestation period. But Max Health’s proposed expansion in Mohali or Dwaraka Delhi, which is closer to its existing base of operations, should mature earlier.
The hospital industry is eyeing a strong growth path through capital expansion. The structural factors of lower government health expenditure, rising income levels coupled with insurance penetration and deep under-penetration of services do support the case for expansion.
Investors need to watch execution closely, as rapid capacity expansion could cause short-term swings in ARPOBs even though the long-term growth thesis remains intact.
Published on October 25, 2025
Images are for reference only.Images and contents gathered automatic from google or 3rd party sources.All rights on the images and contents are with their legal original owners.