Our Terms & Conditions | Our Privacy Policy
Leading coin Bitcoin briefly soared above the $107,000 mark yesterday. It reached an intraday peak of $107,108, just 2% shy of its all-time high of $109,588, before retracing.
Although the leading cryptocurrency has since retreated slightly to $104,976 at press time, market sentiment remains firmly bullish, with on-chain indicators suggesting continued upward momentum.
Bitcoin Season is in Full Swing
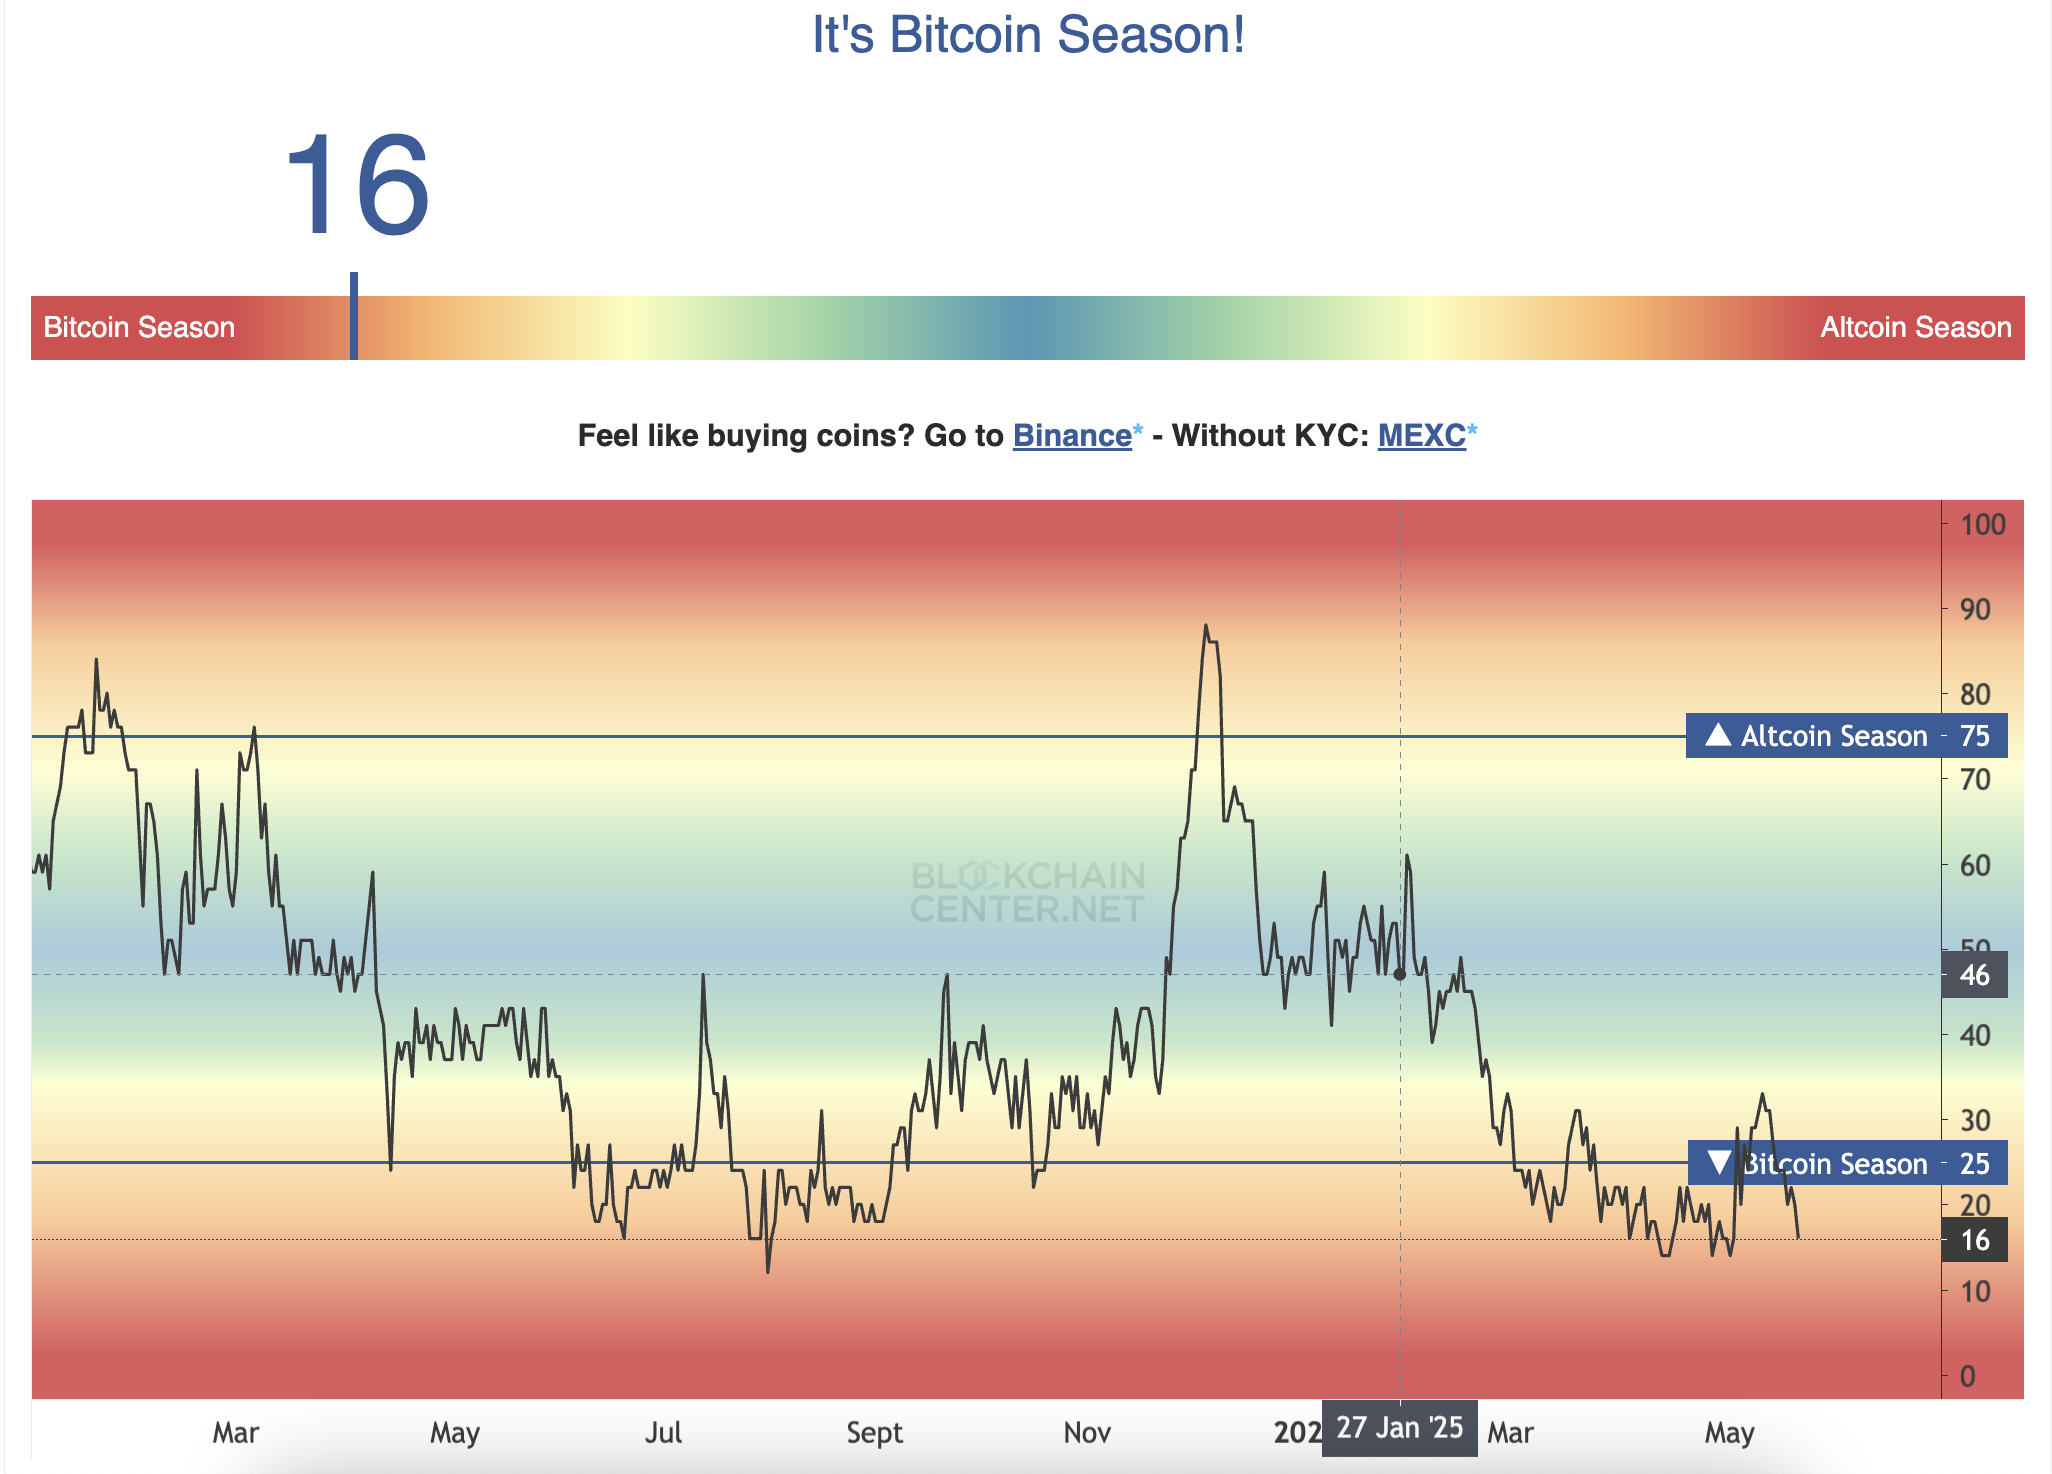
According to data from Blockchain Center, the cryptocurrency market remains deep in “Bitcoin Season,” a period when BTC significantly outperforms the broader altcoin market.
Altcoin Season Index. Source: Blockchain Center
As of this writing, only 16 (32%) of the top 50 altcoins have outperformed BTC over the past 90 days, far below the 75% threshold required to qualify as “Altcoin Season.”
Furthermore, Bitcoin’s rising dominance supports this position. Since plunging to a two-month low of 61.89% on May 16, BTC.D, a metric that tracks BTC’s share of total crypto market capitalization, has climbed steadily.
As of this writing, the metric stands at 63.92%.
 BTC Dominance. Source: TradingView
Interestingly, since May 14, TOTAL2, which measures the combined market cap of all cryptocurrencies excluding BTC, has trended downward. Currently standing at $1.18 trillion, it has plunged $83 billion over the past week.
This divergence suggests market participants are increasingly reallocating capital into BTC over altcoins.
 TOTAL2 Market Cap. Source: TradingView
The current trend signals that traders are doubling down on BTC’s resilience, especially as the king coin attempts to stabilize above the key $105,000 price mark.
BTC’s DMI Points to Strong Buying Pressure
On the daily chart, BTC’s Directional Movement Index (DMI) confirms the bullish pressure in the market. As of this writing, the coin’s positive directional index (+DI, blue) rests above its negative directional index (-DI, orange).
When an asset’s DMI is set up this way, it indicates that bullish momentum is stronger than bearish momentum. This signals a prevailing uptrend and buying pressure in the BTC market.
If this continues, its price could attempt to breach the resistance at $107,048, and rally toward its all-time high of $109,588.
 Bitcoin Price Analysis. Source: TradingView
On the other hand, if sell-offs strengthen, BTC’s price could dip to $102,080.
Disclaimer
In line with the Trust Project guidelines, this price analysis article is for informational purposes only and should not be considered financial or investment advice. BeInCrypto is committed to accurate, unbiased reporting, but market conditions are subject to change without notice. Always conduct your own research and consult with a professional before making any financial decisions. Please note that our Terms and Conditions, Privacy Policy, and Disclaimers have been updated.
Images are for reference only.Images and contents gathered automatic from google or 3rd party sources.All rights on the images and contents are with their legal original owners.
Aggregated From –
Comments are closed.