Our Terms & Conditions | Our Privacy Policy
It’s a testament to the power of citizen science — and it’s not an isolated occurrence, according to a new study, which documents how scientists are harnessing iNaturalist data. Since iNaturalist was founded in 2008, observations submitted to the platform have been incorporated into more than 5,000 peer-reviewed papers, with references exploding in recent years, the scientists found. More than 1,400 such articles were published in 2022 — 10 times as many as just five years earlier and a publication rate of nearly four studies per day.
Get Starting Point
A guide through the most important stories of the morning, delivered Monday through Friday.
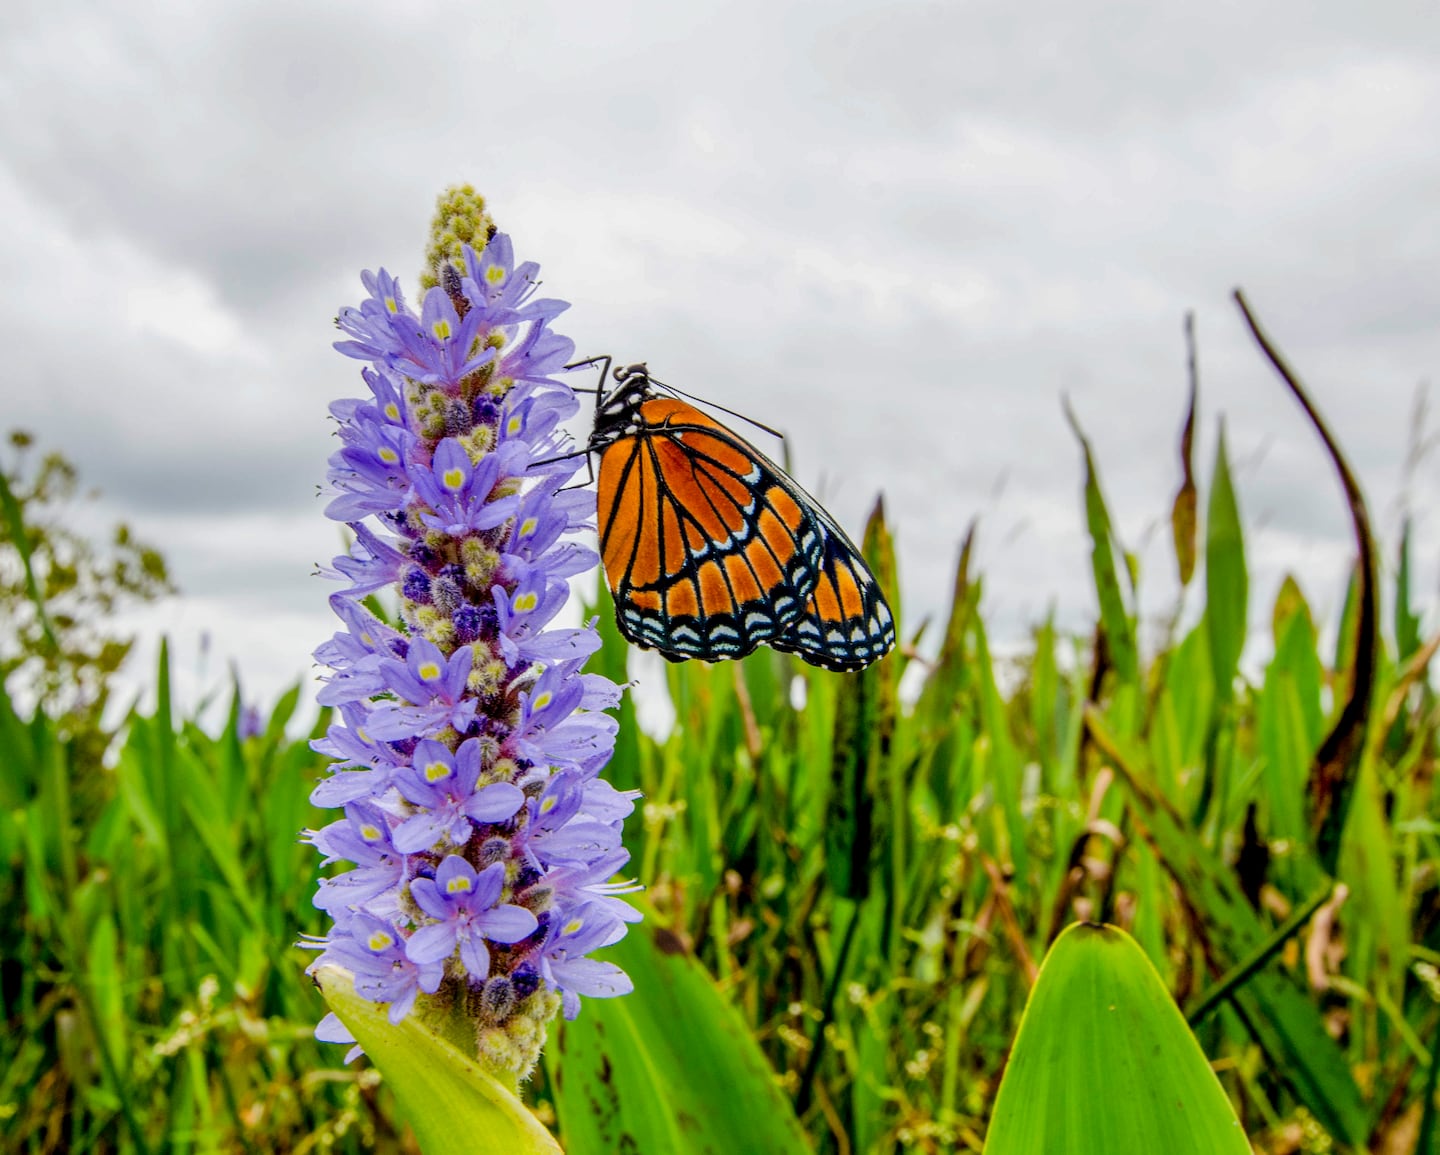
A photo provided by Brittany Mason, a data management analyst at the University of Florida, shows a butterfly she documented.BRITTANY MASON/NYT
The data has helped scientists identify new species, track the spread of invasive organisms, pinpoint critical habitats, predict the effects of climate change and explore animal behavior, among other things.
“INaturalist is really pervasive throughout the biodiversity research,” said Corey Callaghan, an ecologist at the University of Florida and an author of the paper, which was published in BioScience on Monday. “It is fundamentally shaping the way that scientists think about research and think about designing studies and think about answering questions about biodiversity.”
INaturalist users submit photos or audio recordings of the plants and animals they observe, along with the date, time and location. Anyone in the iNaturalist community can suggest an identification for the organism in the observation. If two-thirds of these suggestions agree, and the submission passes the platform’s data quality review, the observation is classified as “research grade,” and sent to a global biodiversity database available to scientists.
The emergence of the platform has coincided with the rise of smartphones equipped with high-quality cameras and audio recorders. The iNaturalist data set has grown exponentially in recent years. As of 2024, it contained more than 200 million observations collected by 3.3 million users.
“We’re seeing this massive growth in data, and it’s allowing us to study things globally and across a lot of taxonomic groups that would be challenging with small professional studies,” said Brittany Mason, a data management analyst at the University of Florida and an author of the study.
 A photo provided by Brittany Mason shows a smartphone with photos of snakes she documented. BRITTANY MASON/NYT
Through May 2024, the researchers had identified 5,250 papers that used iNaturalist data. The papers encompassed observations on more than 600 plant, animal and fungal families observed in 128 countries.
In many published papers, scientists drawing upon iNaturalist observations have analyzed basic data on the presence and absence of particular species: Where and when had certain plants and animals been observed?
But even this seemingly simple data can shed light on many different processes and phenomena. In a 2023 paper, for instance, researchers used iNaturalist data to determine that the geographic range of the jaguarundi, a Latin American wildcat, no longer matched the map drawn up by experts. The cats seemed to have retreated from some former territory in Argentina, Uruguay and Paraguay.
The same sort of basic observational data has been used to detect the spread of invasive shrubs in New York and New Jersey, document how Australian megafires have influenced biodiversity and predict how climate change might affect critically endangered gibbons.
Over the past few years, an increasing share of papers have gone beyond basic presence and absence data to analyze the content of user-submitted photos.
“The iNaturalist imagery is a really rich data source,” Mason said. “And it seems like researchers are starting to pick up on this.” (Machine learning is also making it more feasible for scientists to analyze large image collections.)
Researchers have used iNaturalist images to analyze color variations in butterflies and snakes, compare the flower preferences of native and nonnative bees and document the diets of birds in the Andes.
Still, the authors stress, data from iNaturalist, which has a variety of limitations, will never be a substitute for expert observations and professionally trained field biologists. Data from the platform can complement and accelerate the research that trained scientists are doing, they said.
And Callaghan wants iNaturalist’s users to know that the time and effort they’re putting in is paying dividends. “Keep doing what you’re doing,” he said, “and who knows where the future is going to take us with these data.”
This article originally appeared in The New York Times.
Images are for reference only.Images and contents gathered automatic from google or 3rd party sources.All rights on the images and contents are with their legal original owners.
Aggregated From –
Comments are closed.