Our Terms & Conditions | Our Privacy Policy
Devyani & Swiggy: Are these food stocks ready for a breakout? – Stock Insights News
The Nifty 50 churned lower between April and August on poor earnings and sustained FII selling.
On another note, the Indian QSR business continued to do well, with demand coming from urban & Tier 2/3 areas. Given the strong portfolio of franchise brands and consistent same-store growth, Devyani International has stood its ground. Nifty being technically negative, QSR charts trade on the upside with good volume.
Devyani’s chart: A textbook reversal in the making?
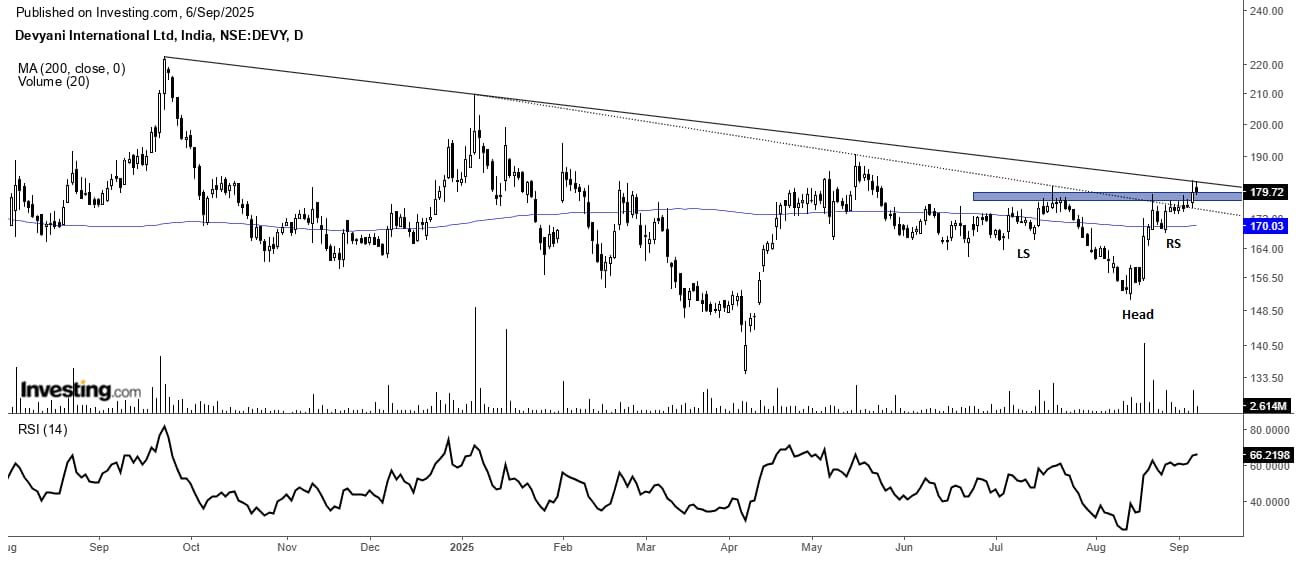
Following a run-up to its lifetime high, the stock of Devyani International experienced a correction of almost 40% from September 2024 to April 2025 (from ₹223 to ₹134). It, however, surprisingly rallied back by approximately 35% again by September 2025. At present, Devyani International shows multiple bullish chart features, with support from a rising trendline and daily candles trading above the 200DMA. RSI, which presently remains in the bullish zone, would strengthen the case for further strength.
Decoding the bullish signals: Four key technical indicators
- Multiple Bullish Supports: The stock is enjoying sound support from a rising trendline as well as from a recent breakout from an Inverted Head and Shoulders pattern, which suggests some up moves ahead.
- 200 Day Moving Average: Stock price holding above its 200DMA indicates the possibility of a trend reversal.
- Price action with Volume: With price, volume has increased steadily, which is usually seen as a confirmation for the bullish scenario.
- Increasing RSI Momentum: RSI is in the bullish zone, signalling the possibility of an upward price movement.
Source: Investing.com
Since we are talking food, here’s another stock that is drawing our attention.
Swiggy: Potential up move & trading at breakout level
Post-IPO, Swiggy witnessed an all-time peak price of ₹617 right as its shares were being floated, and then began to fall. After reaching its all-time high in the so-called bear market, the stock entered into sideways consolidation and was met with a massive 50 percent fall from December 2024 to May 2025, wherein the stock was down from ₹617 to ₹297.
Now it has managed to breach past resistance and is acting as the herald of a rally created by a rounding bottom pattern. It is trading above the 50-day moving average, & the RSI is in bullish territory, which is testing the strength itself.
Key technical levels favouring Swiggy’s reversal
- Rounding bottom pattern: The stock recently gave a breakout from its rounding bottom pattern and now it is retesting the breakout, which is considered the accumulation phase.
- 50 Day SMA: Stock is consistently trading above its 50 Day SMA, when the overall market sentiment has been a bit shaky, which suggests it has some solid strength behind it.
- Volume Surge Confirming the Breakout: The recent price jump has been backed by a noticeable increase in volume, signalling strong interest from market participants.
- RSI Chart & Price Direction: 14 period RSI has climbed above 60 and is showing a bullish divergence, which reinforces the idea that the stock is experiencing strong upward momentum.
 Source: Investing.com
Final Take
Both these companies are showing strong technical signs such as bullish chart patterns, increasing RSI momentum, and key breakouts, which suggest that there could be strong price movements in the upward direction. So, keep a keen eye on these stocks and add them to your watchlist.
Disclaimer:
Note: The purpose of this article is only to share interesting charts, data points & thought-provoking opinions. It is NOT a recommendation. If you wish to consider an investment, you are strongly advised to consult your advisor. This article is strictly for educative purposes only.
Kiran Jani has over 15 years of experience as a trader & technical analyst in India’s financial markets. He is a well-known face on the business channels as Market Experts & has worked with Asit C Mehta, Kotak Commodities, & Axis Securities. Presently, he is Head of the Technical & Derivative Research Desk at Jainam Broking Limited.
Disclosure: The writer & his dependents do not hold the stocks discussed here. However, clients of Jainam Broking Limited may or may not own these securities.
The website managers, its employee(s), & contributors/writers/authors of articles have or may have an outstanding buy or sell position or holding in the securities, options on securities or other related investments of issuers and/or companies discussed therein. The content of the articles & the interpretation of data are solely the personal views of the contributors/ writers/authors. Investors must make their own investment decisions based on their specific objectives & resources, & only after consulting such independent advisors if necessary.
Images are for reference only.Images and contents gathered automatic from google or 3rd party sources.All rights on the images and contents are with their legal original owners.
Aggregated From –
Comments are closed.