Our Terms & Conditions | Our Privacy Policy
Trusted Editorial content, reviewed by leading industry experts and seasoned editors. Ad Disclosure
Data shows the Ethereum spot exchange-traded funds (ETFs) have been on a streak of beating Bitcoin funds for an entire week now.
Ethereum Has Outperformed Bitcoin In Spot ETF Netflows
In a new post on X, institutional DeFi solutions provider Sentora (formerly IntoTheBlock) has talked about the latest trend in the Ethereum spot ETF netflow. Spot ETFs are investment vehicles that allow investors to gain exposure to an underlying asset like ETH without having to directly own the asset.
The ETFs trade on traditional platforms, so investors unfamiliar with digital asset wallets and exchanges can just choose to invest into the cryptocurrency through them.
This pathway into digital assets is relatively new, with BTC only getting spot ETF approval from the US Securities and Exchange Commission (SEC) at the start of 2024 and ETH in mid-2024.
Generally, Bitcoin spot ETFs tend to outpace Ethereum in terms of capital flows, as Bitcoin is the larger asset with more interest behind it. Recently, however, things have been different. As Sentora explains,
Interestingly, ETH ETFs have now outperformed BTC ETFs for seven straight days; a trend that may signal growing investor rotation and strengthening relative sentiment toward ETH.
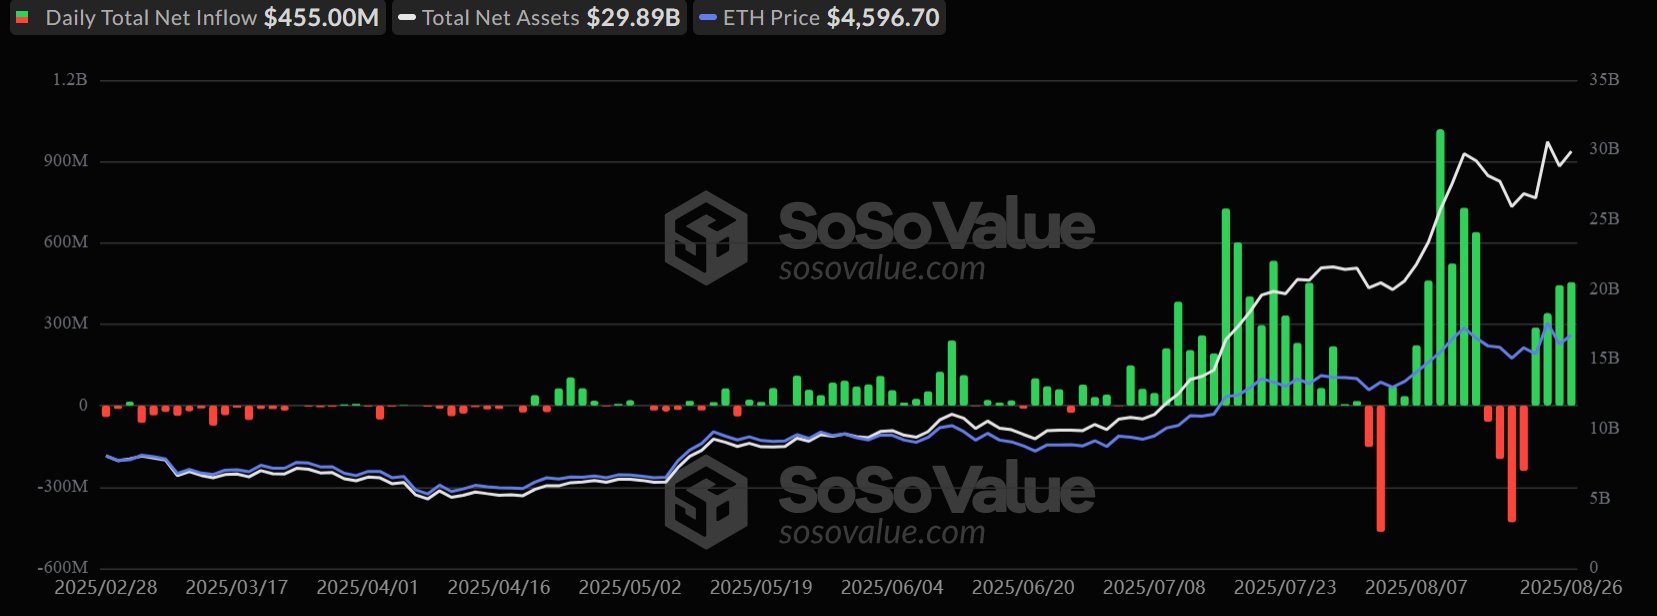
That said, while ETH has done better than BTC in this period, it doesn’t mean the coin has enjoyed only inflows. As data from SoSoValue shows, the coin’s ETFs were facing outflows just earlier.

How the ETH spot ETF netflow has changed over the past few months | Source: Sentora on X
Even during the outflows, however, Ethereum spot ETFs were doing better than Bitcoin’s as they were just bleeding to a lesser degree. In the past few days, the netflow has turned positive for the asset, with net inflows of $455 million occurring on Tuesday.
Before the recent negative flows, the ETH spot ETFs had been on a weekly net inflow run since May, as is apparent from the chart shared by on-chain analytics firm Glassnode.

The trend in the weekly netflow for the US ETH spot ETFs | Source: Glassnode on X
The streak-breaking week saw a net outflow of around 105,000 ETH ($486 million). It now remains to be seen whether the end of this week would bring back green on this graph.
Speaking of weekly figures, another indicator that ETH has recently seen a decline in is the Active Addresses, as Sentora has pointed out in another X post.

The value of the metric appears to have been going down since the earlier high | Source: Sentora on X
As displayed in the above chart, Ethereum saw around 3.8 million addresses participating in transaction activity on the blockchain last week. This is down compared to the peak from early August, but still high when lined up against the past bull markets.
ETH Price
At the time of writing, Ethereum is trading around $4,600, up more than 7% over the last week.
Looks like the price of the coin has bounced off its low | Source: ETHUSDT on TradingView
Featured image from Dall-E, Glassnode.com, SoSoValue.com, defillama.com, chart from TradingView.com

Editorial Process for bitcoinist is centered on delivering thoroughly researched, accurate, and unbiased content. We uphold strict sourcing standards, and each page undergoes diligent review by our team of top technology experts and seasoned editors. This process ensures the integrity, relevance, and value of our content for our readers.
Images are for reference only.Images and contents gathered automatic from google or 3rd party sources.All rights on the images and contents are with their legal original owners.
Aggregated From –
Comments are closed.