Our Terms & Conditions | Our Privacy Policy
Indian economy weakens in January as passenger vehicle sales, PMI lose momentum, shows Mint tracker
The continued weakness in consumer and external sectors weighed on India’s overall economic performance in January, showed the 16 high frequency indicators tracked by Mint in its monthly macro tracker. In comparison to previous month’s performance, there was a mild deterioration, with the momentum in passenger car sales and composite Purchasing Managers’ Index (PMI) declining.
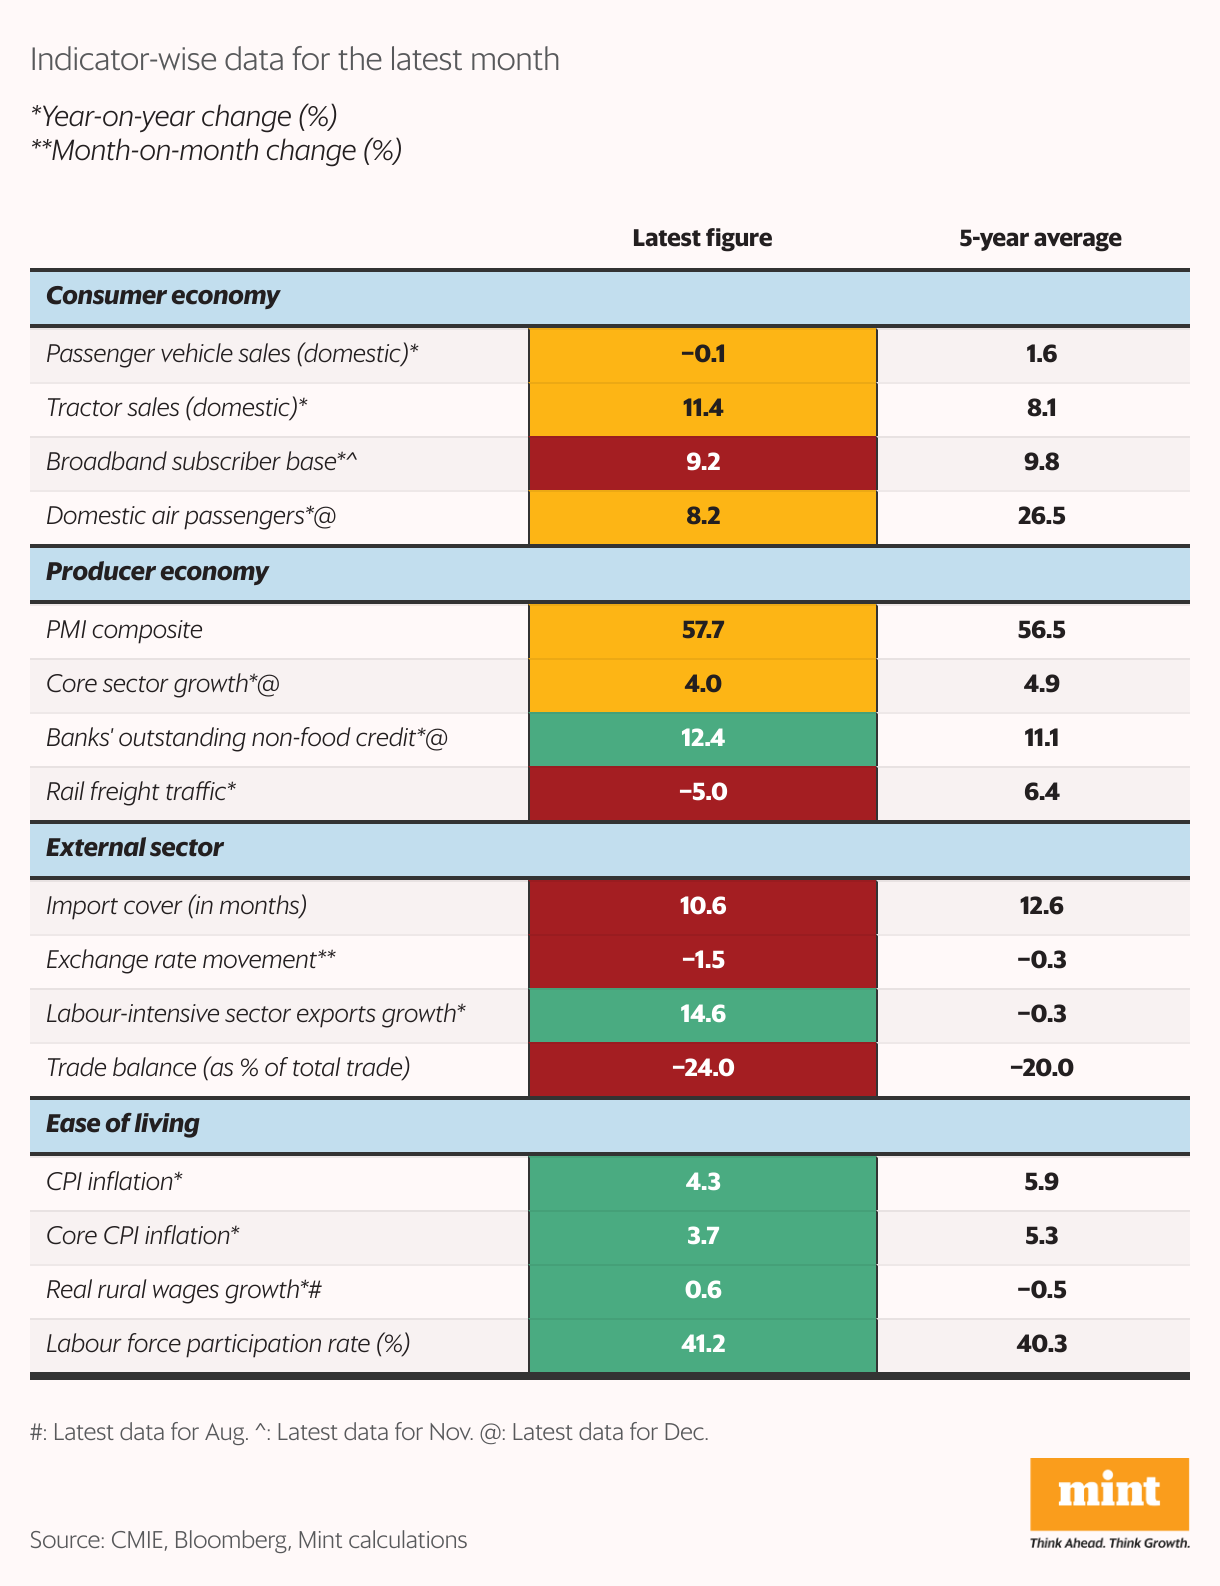
Six indicators were in green, down from seven in December, showcasing the deterioration. However, the number of indicators in red also declined to five from six. The number of indicators in amber increased to five from three the previous month. For each indicator, the value in each month is assigned a colour coding (red, amber and green) to denote where it lies relative to the five-year average (red denotes worse, amber denotes it is in line with the average range, and green denotes better).

The situation has remained more or less the same since the last six months. The consumer segment has stayed mostly in the red and amber zone. In January, passenger vehicle sales growth saw a decline yet again, after seeing a strong growth in December.
The external sector’s performance in the last six months has been concerning as well, with three of the four indicators—import cover, currency and trade balance—staying the red. Labour-intensive sector export was the only outlier in this group for the month of January.
The ease of living segment, comprising retail and core inflation, real rural wages growth and labour force participation rate, has been showing a strong performance, with all four staying mostly in the green.
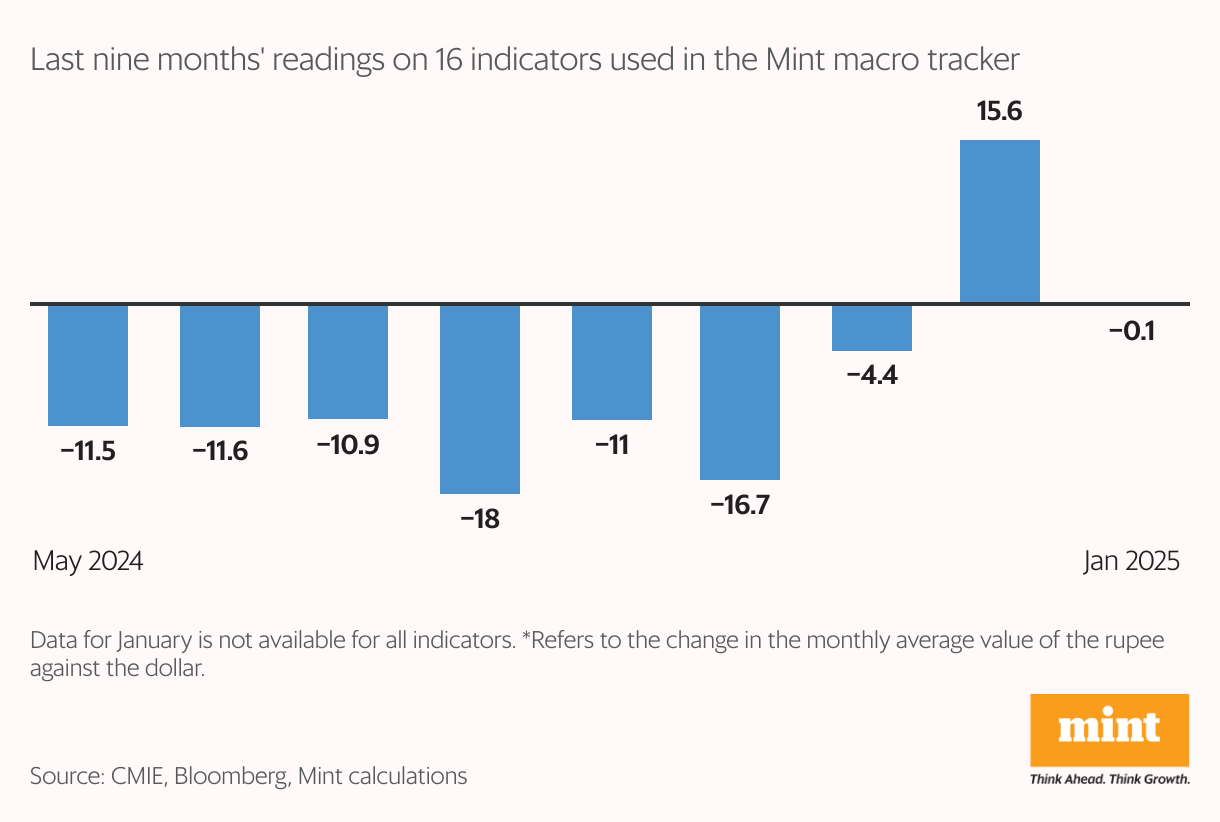
Mint macro tracker, which provides a monthly comprehensive report on the state of the economy, based on trends in 16 high-frequency indicators. The tracker has been running since October 2018.
Methodology note: While calculating the five-year average, data for some indicators for April-May 2020 and April-May 2021 have been removed to eliminate lockdown-induced skews in the trend. However, the five-year averages may still show high figures due to sustained base effect in several indicators in 2021 and 2022.
Monthly standings will get updated retrospectively as more data comes in.
For inflation, the red/green coding is reversed.
Images are for reference only.Images and contents gathered automatic from google or 3rd party sources.All rights on the images and contents are with their legal original owners.
Aggregated From –
Comments are closed.