Our Terms & Conditions | Our Privacy Policy
Market Sell-Off? These 2 shipping stocks are quietly flashing Buy signals – Stock Insights News
Nifty corrected 3% in last six trading sessions. The main trigger for this sell off was the deteriorating sentiment on account of US tariffs and the new rules for H-1B visa.
During this heavy selloff, there appears to be sector rotation in progress. We have witnessed negative sentiment for Pharma and IT stocks and some profit booking in Auto and Banking sectors.
On the other hand, defense and shipping stocks look good at current juncture.
Two shipping stocks offer attractive risk-reward opportunities to investors and traders. Technically, Shipping Corporation of India (SCI) and Cochin Shipyard look strong. Both stocks are indicating signs of strength with favorable momentum indicators. Investors and traders may look to add to their watchlist for short to long-term.
SCI: Bullish Reversal Breakout
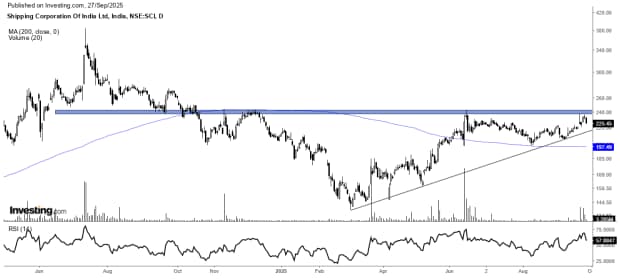
The stock started its decline in July 2024 from all time high peak of ₹384, eventually losing 64% of its value in nine months.
Starting March 2025, it started trading with support of rising trendline and from June 2025 it is consolidating between ₹230 and ₹200. The price action within the range depicts a higher top & higher bottom, which is an early indicator of a reversal.
The stock is currently trading above its 200-day moving average, which is considered as the beginning of an uptrend. On top of that, the 14 period RSI is entering into bullish territory, with bullish divergence, and is further enhancing the bullish possibilities. All these factors imply that the stock is setting up to move upwards in the near future.
Key SCI’s Potential Signs of Reversal
- Bullish Triangle pattern: SCI is on the verge of giving breakout from ascending triangle pattern.
- 200-Day Moving Average: The stock price is trading above its 200 DMA, signalling the onset of an uptrend.
- Breakout with Volume: At current chart setup we can see price is rising with rise in volume which indicates the bullish sentiment.
- RSI & Price Direction: The 14-period RSI is above the 55 zone and showing that the stock is in strong bullish momentum.
Source: Investing.com
Cochin Shipyard: Bullish Reversal Breakout
Cochin shipyard’s shares declined significantly from ₹2,980 to ₹1,180 over July 2024 to February 2025. The decline was subsequently reversed, and the shares have since strongly appreciated from ₹1,180 to ₹2,545, an increase of 115% between February and June 2025.
Since then we can see the price trading in a tight range and forming the symmetrical triangle partnern. The stock price is trading above important resistance levels and above their 200-day moving average, which is a strong sign. The 14 period RSI is also ensuring Bullish momentum, which implies the shares are likely to appreciate further. Cochin shipyard has a positive outlook for growth in the near term, given the current technical indicators.
Cochin Shipyard’s Stock Reversal Analysis
- Consolidation pattern breakout: The price is approaching to breakout from falling trend-line and symmetrical pattern.
- Volume Surge Confirming the Breakout: Fall in price coincided with fall in volme and an Increase in price has come with a rise in volume, which shows strong investor interest.
- 200 Day Moving Average: The stock price is trading higher than its 200 DMA. This means, the stock is on an upward trend.
- RSI & Price Direction: The 14-period RSI is in the near 60 zone and showing that the stock is in strong bullish momentum.
 Source: Investing.com
Final Take
We are of the view technically and fundamentally Indian stocks are very well positioned. Among that the Indian shipping shares could witness bullish strength.
SCI and Cochin Shipyard are technically strong, having crossed key moving averages with increasing volumes. RSI levels are witnessing healthy trends without showing overbought signals. Both counters have breakout potential, underpinned by strong order books and sectoral tailwinds.
Note: The purpose of this article is only to share interesting charts, data points and thought-provoking opinions. It is NOT a recommendation. If you wish to consider an investment, you are strongly advised to consult your advisor. This article is strictly for educative purposes only.
Kiran Jani has over 15 years of experience as a trader and technical analyst in India’s financial markets. He is a well-known face on the business channels as Market Experts and has worked with Asit C Mehta, Kotak Commodities, and Axis Securities. Presently, he is Head of the Technical and Derivative Research Desk at Jainam Broking Limited.
Disclosure: The writer and his dependents do not hold the stocks discussed here. However, clients of Jainam Broking Limited may or may not own these securities.
The website managers, its employee(s), and contributors/writers/authors of articles have or may have an outstanding buy or sell position or holding in the securities, options on securities or other related investments of issuers and/or companies discussed therein. The content of the articles and the interpretation of data are solely the personal views of the contributors/ writers/authors. Investors must make their own investment decisions based on their specific objectives and resources, and only after consulting such independent advisors if necessary.
Images are for reference only.Images and contents gathered automatic from google or 3rd party sources.All rights on the images and contents are with their legal original owners.
Aggregated From –
Comments are closed.