Our Terms & Conditions | Our Privacy Policy
Govt must focus on labour-intensive industries like MSMEs to bridge the income gap
Published Date – 6 January 2025, 10:07 PM
By Prashant Kumar Choudhary, Jadhav Chakradhar
The unequal distribution of income and resources remains a critical challenge globally, affecting both developed and developing nations, including India. The Gini coefficient (accepted measure of income inequality) highlights a growing disparity between society’s wealthiest and poorest segments. This persistent and widening income gap aggravates economic inequalities and heightens social dissatisfaction, potentially leading to increased political instability and social unrest. Addressing this issue requires urgent attention to foster equitable growth and maintain social cohesion.
This article examines the trends in income inequality in India by taking the recently released World Income Inequality database (2024), focusing on the changes in the income shares of the top 1% and top 10% during the pre and post-economic reform periods, as well as under the UPA (2004–2014) and NDA (2014–2023) regimes.
Post-Globalisation
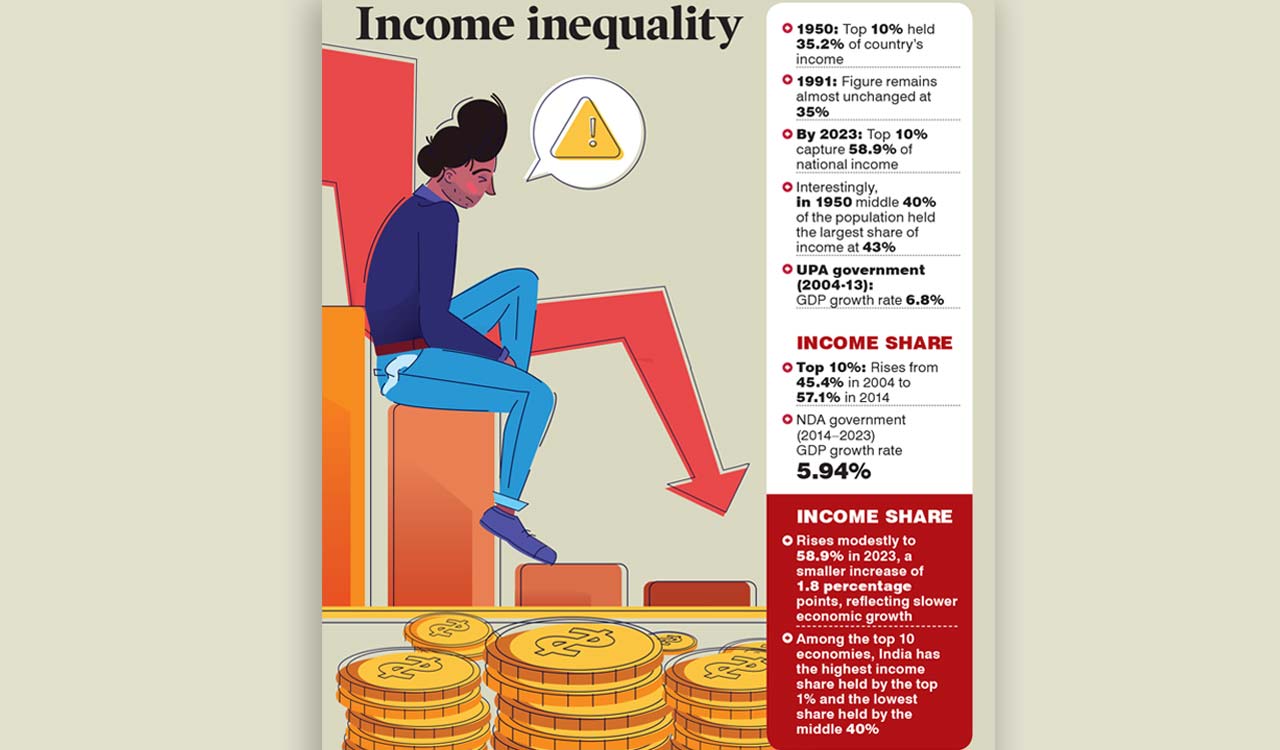
In 1950, the top 10% of India’s population held 35.2% of the country’s income. By 1991, this figure remained almost unchanged at 35%. However, income inequality rose sharply post-globalisation, with the top 10% capturing 58.9% of national income by 2023. Interestingly, in 1950, the middle 40% of the population held the largest share of income at 43%. This share peaked in 1990 but declined significantly post-globalisation as the top 10% increasingly dominated income distribution.
Adopting elements of China’s model — where the state channels investment into underperforming sectors to stimulate demand — may help
During the UPA government (2004-13, the simple GDP growth rate for the period was 6.8%), the top 10% income share rose sharply from 45.4% in 2004 to 57.1% in 2014, an increase of 11.7 percentage points. In contrast, under the NDA government (2014-2023, GDP growth rate for the period was 5.94%), this share rose more modestly to 58.9% in 2023, a smaller increase of 1.8 percentage points, reflecting slower economic growth.
Over 74 years (1950–2023), the top 10% income share increased by 23.7 percentage points. Conversely, the middle 40% and bottom 50% saw declines of over 15 and 8.6 percentage points, respectively, highlighting deepening income inequality.
Rise of Top 1%
The top 1% income share growth rates highlight the stark differences in income concentration across India’s distinct economic and political phases. Before 1991, the top 1% experienced a decline in their income share, shrinking by 8.36%, and there was egalitarian income distribution during the pre-liberalisation era. However, post-1991, the income shares of the top 1% surged by an astounding 120.98%, driven by economic liberalisation that disproportionately benefited the wealthy class.
During the UPA government (2004-14), the income shares of the top 1% grew moderately by 15.52%, reflecting rapid economic growth but limited redistributive measures. In contrast, the NDA period (2014-2023) saw a smaller increase of 6.17%, potentially due to a slower growth trajectory and targeted welfare programmes.
Disproportionate Distribution
The rise in GDP, driven by higher growth rates, has increased income accumulation among the top 1% and 10% of the population while simultaneously reducing the percentage share of national income for the middle 40% and bottom 50%. Over the years, poverty levels in India have significantly declined — from 63.11% in 1977 to 12.9% in 2021 — largely due to the opportunities created post-globalisation in sectors such as services, telecommunications/IT, manufacturing and the informal economy in urban areas. Notably, the percentage of the population below the poverty line (BPL) stood at 47.64% in 1993.
Is rising income inequality an inevitable consequence of economic development? A review of the world’s top ten economies suggests that disproportionate income distribution is a common feature, albeit with contextual differences. Among these economies, India has the highest income share held by the top 1% and the lowest share held by the middle 40%. Furthermore, it has the second-highest income share of the top 10% and the second-lowest share of the bottom 50%, trailing only Brazil. Despite these inequalities, India also ranks lowest in GDP per capita and has the highest poverty rate (13%) among the top ten economies.
Fallacy of Indicators?
The rise in GDP per capita and GDP growth rate must be analysed critically when considering indicators of a country’s overall economic development. While they are vital metrics, it is essential to understand whether GDP per capita is increasing due to income concentration among the top 1% or 10%, thereby inflating the national average, or if economic growth is genuinely benefiting the middle 40% and bottom 50%. Although the income of the remaining 90% of the population has likely increased in absolute terms since 1950, the top 10% have captured a disproportionately large share of the income generated, especially post-globalisation, driven by higher GDP growth rates.
Capitalism has undoubtedly transformed India’s economy, pulling the country from the brink of bankruptcy to becoming one of the world’s top five economies. It has created vast employment opportunities, including in the informal sector, to accommodate India’s large population. Simultaneously, India’s poverty has declined since 1950, particularly after the 1991 economic reforms, reflecting the global trend where higher economic growth rates are typically associated with poverty reduction.
To reduce poverty sustainably, the government must prioritise investments in essential sectors such as health, education, food security, housing and employment. India’s expenditure on education as a total share of GDP in 2022 was 4.12, and on health in 2021 was 3.28, which requires further expansion. The unbridled market economy in the absence of welfare measures might lead to the widening of the inequality gap in the country.
Reducing inequality would require strategically focusing on labour-intensive industries like MSMEs and manufacturing to address high unemployment levels. However, taxing the wealthy (top 1% or 10%) more heavily risks deterring investment, while overburdening the middle class for electoral gains could stifle domestic demand. Instead, adopting elements of China’s model — where the State channels investment into underdeveloped areas and underperforming sectors to stimulate demand — could provide a balanced approach.

(Prashant Kumar Choudhary is with the Department of Public Policy, Manipal Academy of Higher Education [MAHE], Bengaluru. Jadhav Chakradhar is with the Centre for Economic and Social Studies [CESS], Hyderabad)
Images are for reference only.Images and contents gathered automatic from google or 3rd party sources.All rights on the images and contents are with their legal original owners.
Aggregated From –
Comments are closed.