Our Terms & Conditions | Our Privacy Policy
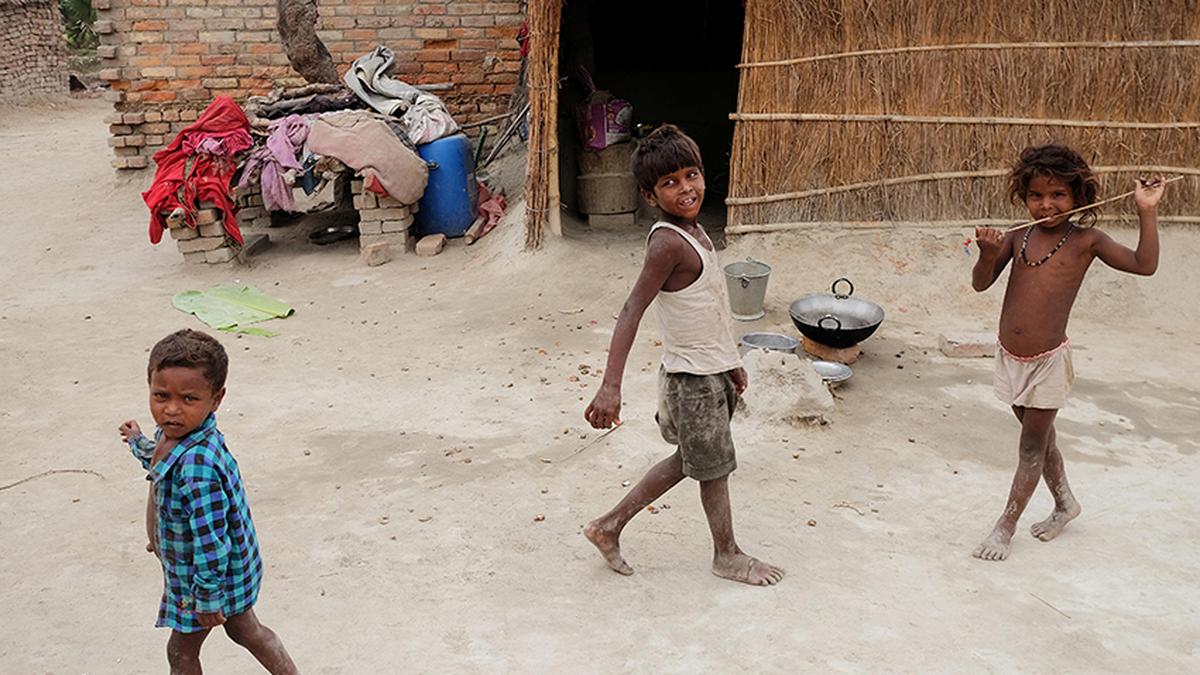
For poverty reduction the growth in per capita income is a necessary condition along with percolation of benefit of this rise to the masses
| Photo Credit:
ALASDAIR PAL
As per World Bank estimates, the poverty in India has declined steeply from 27.1 per cent in 2011-12 to 5.3 per cent by 2022-23 based on NSS/PLFS Household Consumption Expenditure Survey (HCES) data for year 2011–12 and 2022–23 using 2021 purchasing power parity at $3 per day. This decline works out to be 1.82 percentage points per annum (ppa).
Some scholars have argued that the HCES data from the NSS, 2011-12 and PLFS, 2022-23 are not directly comparable because of difference in recall period and thus require adjustments. Himanshu, Peter Lanjouw, Philipp Schirmer (EPW, 2025) make the data comparable and then used appropriate price deflators to estimate reduction in poverty from 37.2 per cent to 21.9 per cent during Fy2005-12 (2004-05 to 2011-12) and then further to 9.9 per cent by 2022-23 by applying Tendulkar Committee definition of poverty line.
Based on this, they argued that the pace of poverty reduction has in fact come down to half with 1.09 ppa decline during FY2012-23 compared to 2.18 ppa during Fy2004-05. Some light could be shed on such counter claims by reviewing the performance of some other macro indicators crucial for poverty reduction.
Per capita income and HDI
It is well known that poverty reduction cannot happen on its own and the growth in per capita income (PCY) is a necessary condition for the same along with percolation of benefit of this rise to the masses. The rise in disposable income of masses improves their living standard as well as access to essential services such as education and healthcare. This means the rise in PCY, and the relationship of per capita income (PCY) and Human Development Index (HDI) are crucial for poverty reduction. Mukherjee and Chakraborty, 2010 study used 28 States data for year 1983, 1993, 1999 and 2005 found relationship between increase in PCY and increase in HDI score and were able to establish that such relationship exists in both ways.
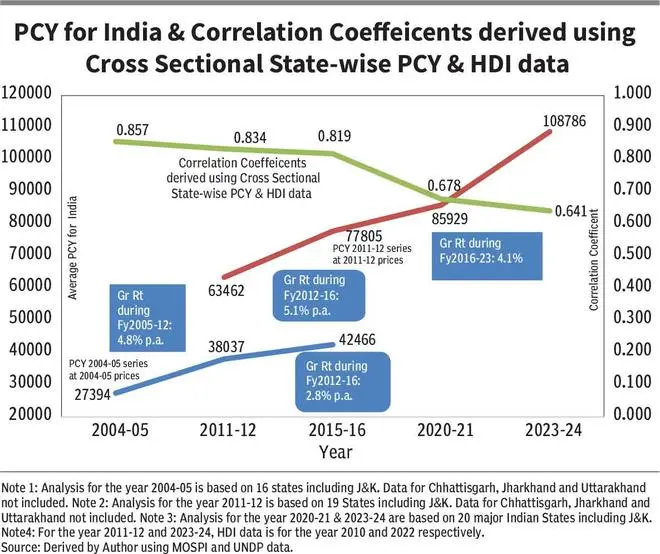
In this article, this relationship between level of PCY at constant price and HDI index is estimated for several points using State-wise cross-sectional data of 20 major States (including that of J&K which now is Union Territory) during the period FY2005-2023. The correlation coefficient is found quite high (>0.8) among these variables at various points (years) of data during the period FY2005-15, but it declined to 0.678 by year 2020-21 and 0.641 in year 2022-23 (Figure 1).
This decline in the relationship between State-wise PCY and State-wise HDI means less improvement in welfare of masses or in other words less poverty reduction with every unit rise in PCY across different States in the country at given point of time after the year 2015-16. This means the benefit of rise in PCY was not percolating to masses to the extent it was happening before 2015-16 and this means that the benefits of rise in PCY across majority of States were remaining confined to rich industrialists, big landlords and high paid employees, etc., while the advantages to lower segments have started reducing compared to the past. The lower relationship happened at the time when PCY growth in the country itself started decelerating and these double setbacks must have been the cause for a reduction in pace of poverty in the country.
As per the data on PCY, the PCY growth during FY2016-23 decelerated to 4.1 per cent p.a. compared to 5.1 per cent p.a. growth for the period Fy2012-16 both based on NAS, 2011-12 series data at 2011-12 prices. This growth during FY2016-23 is also lower compared to PCY growth rate of 4.8 per cent p.a. observed during FY2005-12 based on NAS, 2004-05 series data.
But the point which is vital here is the problem with methodology to measure NAS, 2011-12 series, which is expected to cause over-estimation of the growth rates as highlighted by several scholars (Nagaraj, R & Srinivasan, T N, 2017) as such a growth is not matched with the performance of other macroeconomic indicators. As we are aware, the data in NAS, 2004-05 series is available latest till second quarter of year 2014-15 and PCY growth rate till that period from year 2011-12 are estimated at 2.8 per cent p.a., which could be taken as substitute for PCY growth for the period FY2012-16 and is much lower compared to PCY growth of 5.1 per cent p.a. observed based on NAS, 2011-12 series data as shown in Figure 1.
This means the PCY growth rate of 4.1 per cent p.a. observed for the period FY2016-23 based on NAS, 2011-12 series may also be actually much lower. Thus, the slowdown in growth of PCY might have happened after 2011-12 and further slowed after 2015-16 and hence caused setback to pace of poverty reduction. The pace of poverty reduction after 2015-16 must have further worsened as decline in PCY growth was accompanied by decline responsiveness of PCY growth to HDI.
Unorganised sector woes
The worsening conditions in the unorganised sector after 2016 in which large work force is engaged is one of the important reasons for the slackened response of HDI improvement to rise in PCY during FY2016-23. Annual Survey of Unincorporated Sector Enterprises (ASUSES) data show decline in number of establishments from 63.4 million to 59.7 million and number of workers from 111.3 million to 97.9 million during FY2016-22, while it grew earlier from 57.7 million to 63.4 million establishments and from 108 million to 111.3 million workers during FY2011-16.
The deceleration in incomes and earnings in the unorganised sector could have caused by triple shocks after 2015 i.e., demonetisation in November 2016, inept implementation of GST in 2017 and sudden and starkest Covid lockdowns in 2020.
In this regard, the work of Bedi and Prabhakar, 2020 is relevant. They argued that the GST system by excluding smaller (non-regular GST/composite) units from availing input credit on already paid GST and then over and above charge 1 per cent GST on their entire value of output cause cascading tax impact. Moreover, no regular units want to purchase from such smaller units as the buyer units procuring from (non-regular GST/composite) are not allowed to avail input tax credit for such purchases. Thus, smaller units are excluded from the entire value chain process of large units and hence the employment and value addition of such units has severely hit.
These findings suggest that the pace of poverty reduction might have reduced after 2011-12 and more so during the period FY2016-23.
The writer is Professor of Economics at Institute for Development and Communication, Chandigarh. Views expressed are personal
Published on July 16, 2025
Images are for reference only.Images and contents gathered automatic from google or 3rd party sources.All rights on the images and contents are with their legal original owners.
Aggregated From –
Comments are closed.