Our Terms & Conditions | Our Privacy Policy
The Nifty 50 closed at 24,609.70, down 203.75 points or 0.82%, while the BSE Sensex fell 644.64 points to settle at 80,951.99, marking a pause in the recent upward momentum. Interestingly, the Bank Nifty showed resilience by closing in the green at 54,941.30, up 133.80 points or 0.24%, indicating some strength in the financial space.
Top 3 stocks recommended by Ankush Bajaj
Buy: Hindustan Aeronautics Ltd (HAL)
Current price: ₹5,040
Why it’s recommended: After making new highs, the stock witnessed two days of selling pressure. However, in the last two sessions, it has formed strong green candles that have effectively covered the recent dip. On the 45-minute chart, HAL has also given a breakout from a triangle pattern, which indicates a potential target of around ₹5,400+. This breakout, along with price strength, suggests the possibility of a strong rally in the stock.
Key metrics
Resistance level: ₹5,115-5,135 (short-term target zone)
Support level: ₹4,996 (pattern invalidation level)
Pattern: Triangle breakout on 45-minute chart
RSI: Bullish on lower time frames, confirming the breakout
Technical analysis: The stock has broken out of a bullish continuation pattern on the intraday chart, with price action showing strength and follow-through buying. RSI confirmation adds confidence to the bullish setup. Sustaining above ₹5,040 increases the probability of reaching the target zone.
Risk factors: Breakdown below ₹4,996 may invalidate the breakout. Broader market weakness or negative sentiment in the defense sector may impact performance.
Buy at: ₹5,040
Target price: ₹5,115-5,135 in 4-5 days
Stop-loss: ₹4.996
Buy: Solar Industries Ltd
Current price: ₹15,008
Why it’s recommended: After a strong breakout at the ₹13,400 level, the stock has continued its upward momentum and closed at a new lifetime high, indicating strong bullish sentiment. Additionally, on the 15-minute chart, the stock has given a reliable breakout at the ₹14,400 level, which projects a target of around ₹15,650, aligning with our first target. The price action remains strong, and the breakout levels are being respected, suggesting further upside in the short term.
Key metrics
Resistance level: ₹15,650-15,800 (short-term target zone)
Support level: ₹14,700 (pattern invalidation level)
Pattern: Breakout on 15-minute chart from consolidation
RSI: Bullish and supports the trend
Technical analysis: The stock has given multiple bullish breakouts—first on the daily chart and then on the lower time frame. Sustaining above ₹15,000 with good volumes indicates strong buying interest. The breakout at ₹14,400 confirms the trend, with RSI showing positive momentum.
Risk factors: Breakdown below ₹14,700 may invalidate the breakout. Any sudden reversal in sentiment or broader market weakness can impact the setup.
Buy at: ₹15,008
Target price: ₹15,650-15,800 in 4-5 days
Stop-loss: ₹14,700
Buy: Bharat Electronics Ltd (BEL)
Current price: ₹383
Why it’s recommended: The stock is showing strong momentum and recently gave a significant breakout near the ₹340 level after a long consolidation phase. This breakout has been followed by steady upward movement, indicating sustained buying interest. Given the strength and structure of the price action, a good rally is expected in the near term.
Key metrics
Resistance level: ₹394-399 (short-term target zone)
Support level: ₹377 (pattern invalidation level)
Pattern: Breakout after long consolidation
RSI: Positive, supporting bullish momentum
Technical analysis: BEL has broken out of a long consolidation range and is sustaining above key levels with increasing volumes. The recent move shows strength, and the trend remains positive as long as the price stays above ₹377.
Risk factors: Breakdown below ₹377 may invalidate the setup. Market volatility or sector-specific weakness could impact the short-term trend.
Buy at: ₹383
Target price: ₹394-399 in 4-5 days
Stop-loss: ₹377
Market wrap: A sectoral perspective
India’s stock market reflected broad-based weakness on Thursday, with no sector managing to close in the green. FMCG was the worst performer, declining 1.44% as traders moved away from defensive plays amid market volatility. The oil & gas sector dropped 1.17% following recent strong gains, while the auto sector fell 1.01%, despite some intraday recovery driven by infrastructure-related optimism.
Despite the overall weakness, a few individual stocks managed to end in the green. IndusInd Bank rose 1.95%, supported by institutional buying and sector rotation. Bajaj Auto gained 0.53% as improving sentiment around export recovery attracted buyers. Bharti Airtel edged up 0.49%, continuing its positive trend following a strong earnings report.
On the downside, several large-cap names faced selling pressure. ONGC dropped 2.82% due to profit booking after its recent gains. Mahindra and Mahindra declined 2.73% on concerns about rising commodity costs, and Tech Mahindra fell 2.04%, weighed down by institutional selling and a broader rotation out of the IT sector.
View Full Image
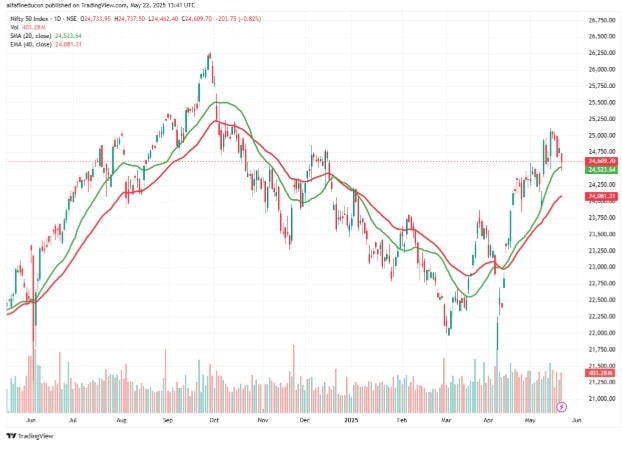
Nifty technical analysis daily and hourly (TradingView)
On the daily chart, Nifty has formed a big red candle with a long upper wick, indicating selling pressure at higher levels. The last two sessions formed inside bars, suggesting consolidation after the sharp move. Interestingly, the index touched its 20-day moving average at 24,523 during the day and managed to close above it, showing that this level is being respected as support. The 40-day exponential moving average stands at 24,081, which still keeps the medium-term trend intact on the upside.
")
View Full Image
(TradingView)
On the hourly chart, however, we’ve observed a negative crossover between the 20-hour moving average and the 40-hour exponential moving average, which signals weakness in the short term. Currently, 24,500 acts as a crucial support level, while 24,800 remains the immediate resistance. Unless we see a decisive breach on either side, the market is likely to remain range-bound in the near term.
Ankush Bajaj is a Sebi-registered research analyst. His registration number is INH000010441.
Investments in securities are subject to market risks. Read all the related documents carefully before investing.
Registration granted by Sebi and certification from NISM in no way guarantee performance of the intermediary or provide any assurance of returns to investors.
Disclaimer: The views and recommendations given in this article are those of individual analysts. These do not represent the views of Mint. We advise investors to check with certified experts before making any investment decisions.
Images are for reference only.Images and contents gathered automatic from google or 3rd party sources.All rights on the images and contents are with their legal original owners.
Aggregated From –
Comments are closed.