Our Terms & Conditions | Our Privacy Policy
Europe may be one of the wealthiest regions on the planet, but living standards still vary widely across the continent.
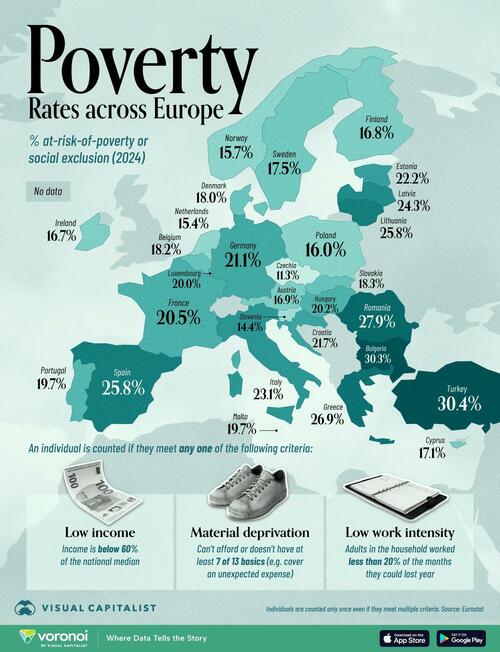
The map below, via Visual Capitalist’s Pallavi Rao, spotlights Europe’s poverty rates in 2024, measured by the share of people at risk of poverty or social exclusion in each country.
The data for this visualization comes from Eurostat.
Unlike how the U.S. measures poverty (income to afford food), there are three related indicators that the EU looks for.
Individuals are included if they meet any one of the below thresholds (but are only counted once if they meet multiple criteria):
-
Income below 60% of the national median.
-
Material deprivation: where they cannot meet or do not have, seven of 13 key basics: i.e. being able to shoulder an unexpected expense, keeping their home warm, having an internet connection, etc.
-
Low work intensity: Adults (18–64) in the household worked ≤20% of the months they could last year.
Ranked: Europe’s Poverty Rates by Country
Bulgaria (30.3%), Türkiye (30.4%), and Romania (27.9%) top the ranking, with roughly one in three residents facing economic hardship.
These higher rates echo lower average wages, higher income inequality, and weaker social-safety nets compared to the EU core.
| Rank | Country | ISO Code | % at-risk-of-poverty or social exclusion |
|---|---|---|---|
| 1 | Türkiye | TUR | 30.4% |
| 2 | Bulgaria | BGR | 30.3% |
| 3 | Romania | ROU | 27.9% |
| 4 | Greece | GRC | 26.9% |
| 5 | Spain | ESP | 25.8% |
| 6 | Lithuania | LTU | 25.8% |
| 7 | Latvia | LVA | 24.3% |
| 8 | Italy | ITA | 23.1% |
| 9 | Estonia | EST | 22.2% |
| 10 | Croatia | HRV | 21.7% |
| 11 | Germany | DEU | 21.1% |
| 12 | France | FRA | 20.5% |
| 13 | Hungary | HUN | 20.2% |
| 14 | Luxembourg | LUX | 20.0% |
| 15 | Malta | MLT | 19.7% |
| 16 | Portugal | PRT | 19.7% |
| 17 | Slovakia | SVK | 18.3% |
| 18 | Belgium | BEL | 18.2% |
| 19 | Denmark | DNK | 18.0% |
| 20 | Sweden | SWE | 17.5% |
| 21 | Cyprus | CYP | 17.1% |
| 22 | Austria | AUT | 16.9% |
| 23 | Finland | FIN | 16.8% |
| 24 | Ireland | IRL | 16.7% |
| 25 | Poland | POL | 16.0% |
| 26 | Norway | NOR | 15.7% |
| 27 | Netherlands | NLD | 15.4% |
| 28 | Slovenia | SVN | 14.4% |
| 29 | Czechia | CZE | 11.3% |
| EU | EUR | 21.0% |
Note: Data unavailable for missing countries, including ones not tracked by Eurostat.
Greece (26.9%) and Spain (25.8%) also stand out in the south, where unemployment rates climbed after the 2008–2014 sovereign-debt crisis and never fully recovered. Persistent youth unemployment has made it harder for younger generations to accumulate wealth.
Lithuania (25.8%) and Latvia (24.3%) lead the Baltic region, highlighting a lingering urban-rural divide.
Households in rural areas earn roughly 20% less than those in cities, a gap that widens vulnerability to social exclusion.
Northern and Central Europe Show Lowest Poverty Risk
Czechia posts the lowest share at 11.3%, followed by Slovenia (14.4%) and the Netherlands (15.4%).
These countries pair higher median wages with extensive welfare programs that cushion income shocks.
Scandinavian nations cluster near the EU average: Finland (16.8%), Sweden (17.5%), and Denmark (18.0%).
Germany (21.1%) sits slightly above the EU average (21.0%), reflecting disparities between industrial southwest regions and lower-income eastern Länder. This is an echo of reunification divides that still influence living standards today.
The EU’s 2030 Poverty-Reduction Target
Brussels aims to lift at least 15 million residents, including 5 million children, out of poverty or social exclusion by 2030. Progress has stalled since the pandemic, as inflation eroded real wages and increased energy and food bills.
Success may hinge on improving access to affordable housing, upskilling workers for higher-productivity jobs, and closing gender pay gaps.
Without faster income growth in southern and eastern member states, the bloc risks entrenching a north-south divide.
If you enjoyed today’s post, check out America’s Poverty Rates by State on Voronoi, the new app from Visual Capitalist.
Loading recommendations…
Images are for reference only.Images and contents gathered automatic from google or 3rd party sources.All rights on the images and contents are with their legal original owners.
Aggregated From –
Comments are closed.