Our Terms & Conditions | Our Privacy Policy
While FIIs sell large-caps, They’re quietly loading up on these 2 small-cap stocks – Stock Insights News
Small caps are not known to have a huge following in the traditional investor circles, due to the myths associated with them. Many investors stay away from them due to the associated risks. However, with the right strategy and research, there’s potentially big rewards at the end of the tunnel. The risk reward ratio is what makes small caps lucrative.
And when small caps get the attention of Foreign smart money, it means they deserve a deep dive into. Because FIIs invest only after through vetting and this checks one of the boxes that most investors have in their list.
Today we look at 2 small stocks that were able to grab the attention of FIIs recently, even as FIIs continue to move money out of India. One of these small caps is from the textiles sector and the other from Auto Components. Do you own any of these?
Vishal Fabrics Ltd
Incorporated in 1985, Vishal Fabrics Ltd manufactures and sells various Textile products like Dyed yarn, Denim Fabrics and job work of Textile products.
With a market cap of Rs 774 cr, Vishal Fabrics Ltd is a part of the Ahmedabad-based Chiripal Group and boasts of an enviable clientele which includes Lee, Roadster, Zara, Emporio Armani, Calvin Klein, Being Human, H&M, Diesel, Levi’s, Tommy Hilfiger, Gas etc.
The FII holding of Vishal Fabrics went from 3.25% in the quarter ending March 2025 10.9% in the quarter ending June 2025, and finally to 17.05% that was reported for July 2025.
Elysian Wealth Fund holds 6.7% stake apart from North Star Opportunities Fund just bought a 3.4% stake and Multitude Growth Funds Limited’s 2.22% stake in the company.
Vishal Fabric’s consolidated financials are not available on screener.in, so we have looked at the stand-alone numbers.
The sales for Vishal Fabrics grew from Rs 1,297 cr in FY20 to Rs 1,520 cr in FY25, logging in a compound growth of 3.3% in 5 years.
The EBITDA (earnings before interest, taxes, depreciation, and amortization) went from Rs 103 cr to Rs 116 cr in the same period, marking a compound growth of a mere 2.4%.
The net profits seem like a grey area, with a lot of ups and downs.
| FY | FY20 | FY21 | FY22 | FY23 | FY24 | FY25 |
| Net Profit (Rs Cr) | 30 | 18 | 69 | 53 | 21 | 24 |
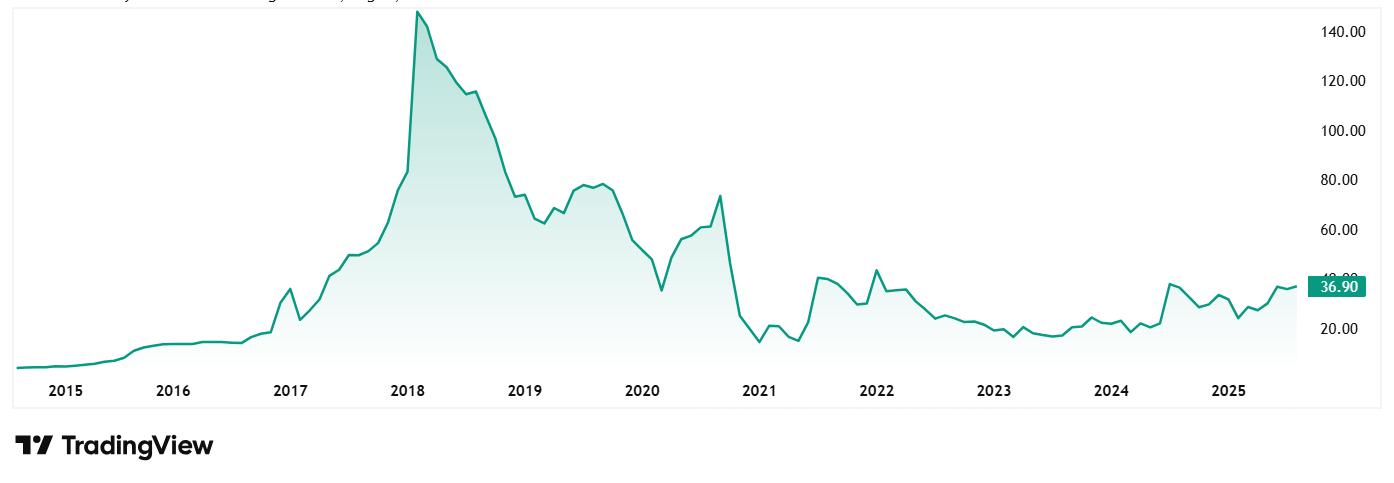
The share price of Vishal Fabrics Ltd was around Rs 60 in August 2020 as of closing on 5th August 2025 it was Rs 37, which is a big drop. At the current price, the stock is trading at a discount of almost 77% from its all-time high price of Rs 160.
The company’s share is trading at a PE of a huge 27x, while the industry median is 33x. The 10-Year median PE for Vishal Fabrics is 24x and the industry median for the same period is 26x.
Vishal Fabrics recently converted 75,00,000 warrants into an equal number of equity shares of the Company, which were bought by North Star Opportunities Fund, under the non-promoter, public category.
In January 2024, Ms. Priyanka Brijmohan Chiripal, part of the promoter group was
issued an Adjudication Order from SEBI and imposed a penalty of Rs. 1 Lac. Company’s stock was withdrawn from dealing on NSE on January 1st, 2024, and hence the company is only listed on the BSE.
RACL Geartech Ltd
Incorporated in 1983, RACL Geartech Ltd manufactures and exports automotive gears and components.
With a market cap of Rs 1,109 cr the company specializes in Gear Cutting, Precision Machining, Aluminium Machining, Process R&D & Concurrent engineering, Heat Treatment, sub-assembly, Laser Welding & Laser Cutting.
The FII holding in RAGCL Geartech grew from 0.03% as of the quarter ending March 2025 to 8.8% as of the quarter ending June 2025.
Malabar India Fund Limited bought a 5.9% stake in the company and Ashoka India Equity Investment Trust Plc bought another 1.8% stake.
However, the promoter holding has dropped from 51% to 43% between the same 2 quarters.
The company’s sales jumped from Rs 212 cr in FY20 to Rs 417 cr in FY25 which is a compound growth of 14% in 5 years.
EBITDA also grew from Rs 43 cr in FY20 to Rs 84 cr in FY25, logging in a compound growth of 14%.
The net profits however saw a ride with some ups and down in the last 5 years.
| FY | FY20 | FY21 | FY22 | FY23 | FY24 | FY25 |
| Net Profit (Rs Cr) | 17 | 23 | 24 | 37 | 40 | 26 |
The share price of RACL Geartech Ltd was around Rs 67 in August 2020 and as of closing on 5th August 2025, it was Rs 935, which is a growth of almost 1,300%.

At the current price, the company’s share is trading at a discount of 39% from its all-time high price of Rs 1,525.
The company is currently trading at a PE of 43x, which is higher than the current industry median of 29x. The 10-year median PE for the company is however 12x and the industry median for the same period is 24x.
According to the RACL Geartech Ltds latest investor presentation in June 2025, the company is navigating near-term headwinds (notably KTM disruption and flat European demand) with a strong focus on balance sheet strengthening, new project ramp-ups, and customer diversification. Margin discipline remains a core strength. The company is well-positioned for medium-term growth, with capex and operational plans aligned to achieve its stated ambition of ₹1000 cr revenue in 3-4 years, subject to macro and customer-specific developments.
Follow The Foreign Smart Money?
FIIs know their investments and they don’t invest easily. They have very stringent checks and balances in place to ensure that the most potent opportunities get the money. But in life and in markets, nothing is fool proof, and exceptions are always a reality.
These 2 less known small cap stocks have recorded some strong financials and steady growth in the last few years, which is what got the attention of FIIs and had them put their money into the companies. The big question now is, how sustained will be this foreign money? Will it be here to stay or gone by the next quarter?
Well only time will be able to tell that, but for now, the intelligent next step will be to add these less known small caps to the watchlist and keep a very close eye on them.
Disclaimer:
Note: We have relied on data from www.Screener.in and www.trendlyne.com throughout this article. Only in cases where the data was not available, have we used an alternate, but widely used and accepted source of information.
The purpose of this article is only to share interesting charts, data points and thought-provoking opinions. It is NOT a recommendation. If you wish to consider an investment, you are strongly advised to consult your advisor. This article is strictly for educative purposes only.
Suhel Khan has been a passionate follower of the markets for over a decade. During this period, He was an integral part of a leading Equity Research organisation based in Mumbai as the Head of Sales & Marketing. Presently, he is spending most of his time dissecting the investments and strategies of the Super Investors of India.
Disclosure: The writer and his dependents do not hold the stocks discussed in this article.
The website managers, its employee(s), and contributors/writers/authors of articles have or may have an outstanding buy or sell position or holding in the securities, options on securities or other related investments of issuers and/or companies discussed therein. The content of the articles and the interpretation of data are solely the personal views of the contributors/ writers/authors. Investors must make their own investment decisions based on their specific objectives, resources and only after consulting such independent advisors as may be necessary.
Images are for reference only.Images and contents gathered automatic from google or 3rd party sources.All rights on the images and contents are with their legal original owners.
Aggregated From –
Comments are closed.