Our Terms & Conditions | Our Privacy Policy
(MENAFN- Crypto Breaking) In recent weeks, Bitcoin ‘s price decline has ignited debates within the crypto community about whether the market is experiencing a healthy correction or the onset of a bear trend. While some traders see promising signs of recovery, others caution that historical fractals and technical patterns suggest a potential dip to as low as $60,000. As the crypto market navigates these uncertain waters, analysts remain divided on Bitcoin’s next move, raising questions about the trajectory of the leading cryptocurrency and the broader implications for blockchain enthusiasts and investors.
-
Historical 2021 Bitcoin fractals indicate a possible correction down to $60,000 if past patterns repeat.
Current technical analysis shows a breakdown of the rising wedge, increasing the risk of a decline to $60,000–$62,000.
Some traders believe Bitcoin could rebound above $124,500, fueled by support around the $104,000–$106,000 zone.
Optimistic analysts see the dip as a healthy correction before a potential rally to $140,000 or higher.
Market sentiment remains cautious, with macroeconomic factors like Fed rate cuts influencing crypto price movements.
Bitcoin (BTC ) has declined over 12.75% from its recent peak above $124,500, splitting traders into those viewing this as a routine market correction and others foreseeing the start of a bearish cycle. The current volatility fuels debate about whether the recent downturn is a temporary setback or a sign of deeper market corrections to come.
Bitcoin 2021 fractals hint at $60,000
Several technical analysts point to fractal patterns from Bitcoin’s 2021 price chart, suggesting the recent price movements could mirror the market top that led to a significant correction. As crypto analyst Reflection explains, in 2021, Bitcoin experienced a sharp rally to nearly $69,000 before a blow-off top, followed by a correction down to around $32,000. This sequence was characterized by a retest of resistance that failed to hold.
BTC /USD two-day price chart. Source: Reflection/TradingView
Current price structure appears to echo this pattern, with Bitcoin trading just below a key distribution zone that previously signaled bearish reversal. Should history repeat, the fractal suggests a potential retracement to the $60,000–$62,000 range, aligning with the 200-week exponential moving average (EMA).
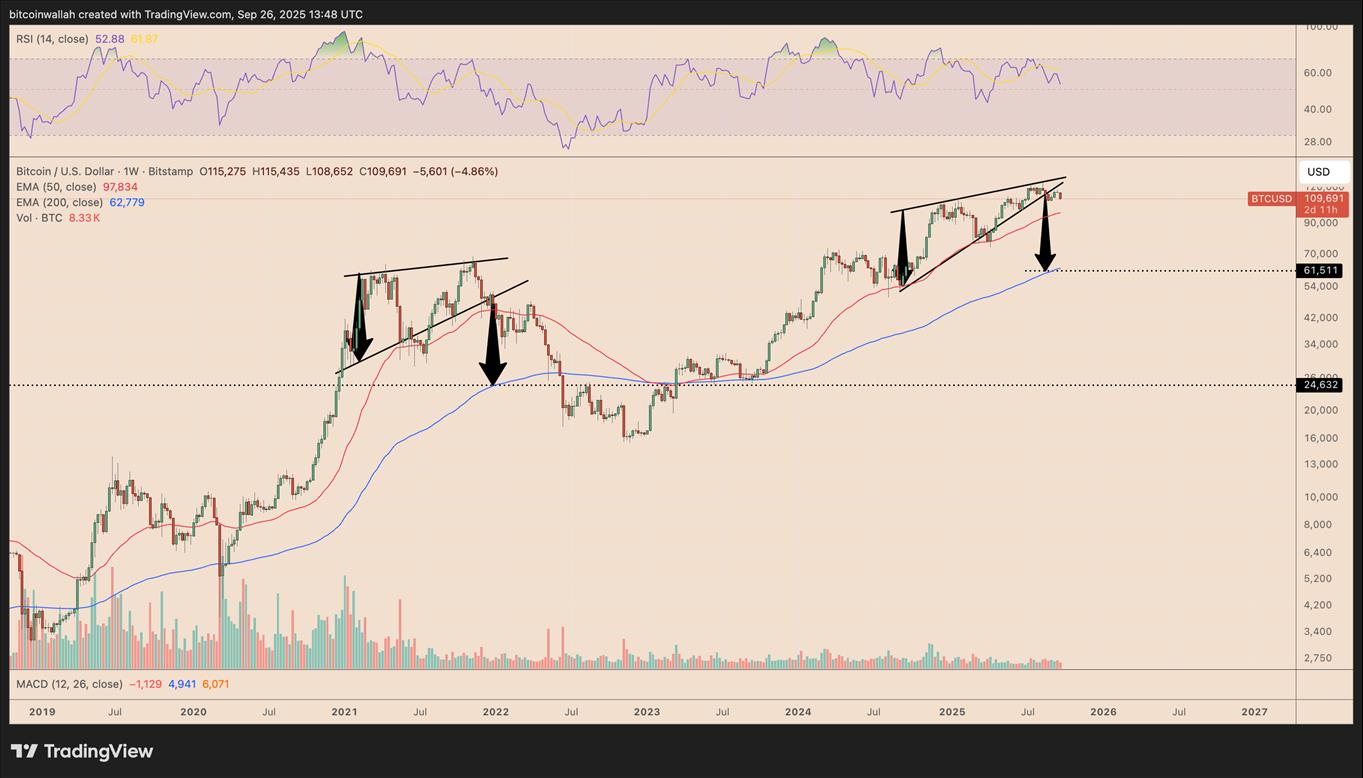
Moreover, on the weekly chart, Bitcoin broke below a rising wedge , a bearish pattern indicating the possibility of a sharp decline. Such breakdowns historically led to corrections approaching 55%, with the 200-week EMA acting as strong support.
BTC/USD weekly price chart. Source: TradingView
Current targets suggest a drop to the $60,000–$62,000 zone, with some analysts even predicting Bitcoin may fall as low as $50,000. However, the overall trend remains uncertain, depending on whether these fractal patterns hold or are broken.
Bitcoin May Rebound to Over $124,500
Not everyone shares a bearish outlook. Traders like Jesse highlights believe the $104,000–$106,000 support zone, anchored by the 200-day simple and exponential moving averages, provides a strong base for a mid-term recovery. This area has historically served as a solid floor during bull market dips.

BTC/USD daily price chart. Source: Jesse/TradingView
As of Friday, the support levels around $104,000 to $106,000 are considered crucial for potential rebound scenarios. Analyst Bitbull notes that Bitcoin’s broader economic indicators – such as the US Business Cycle – have yet to reach their peak, implying that a rally could still unfold before a downturn occurs.
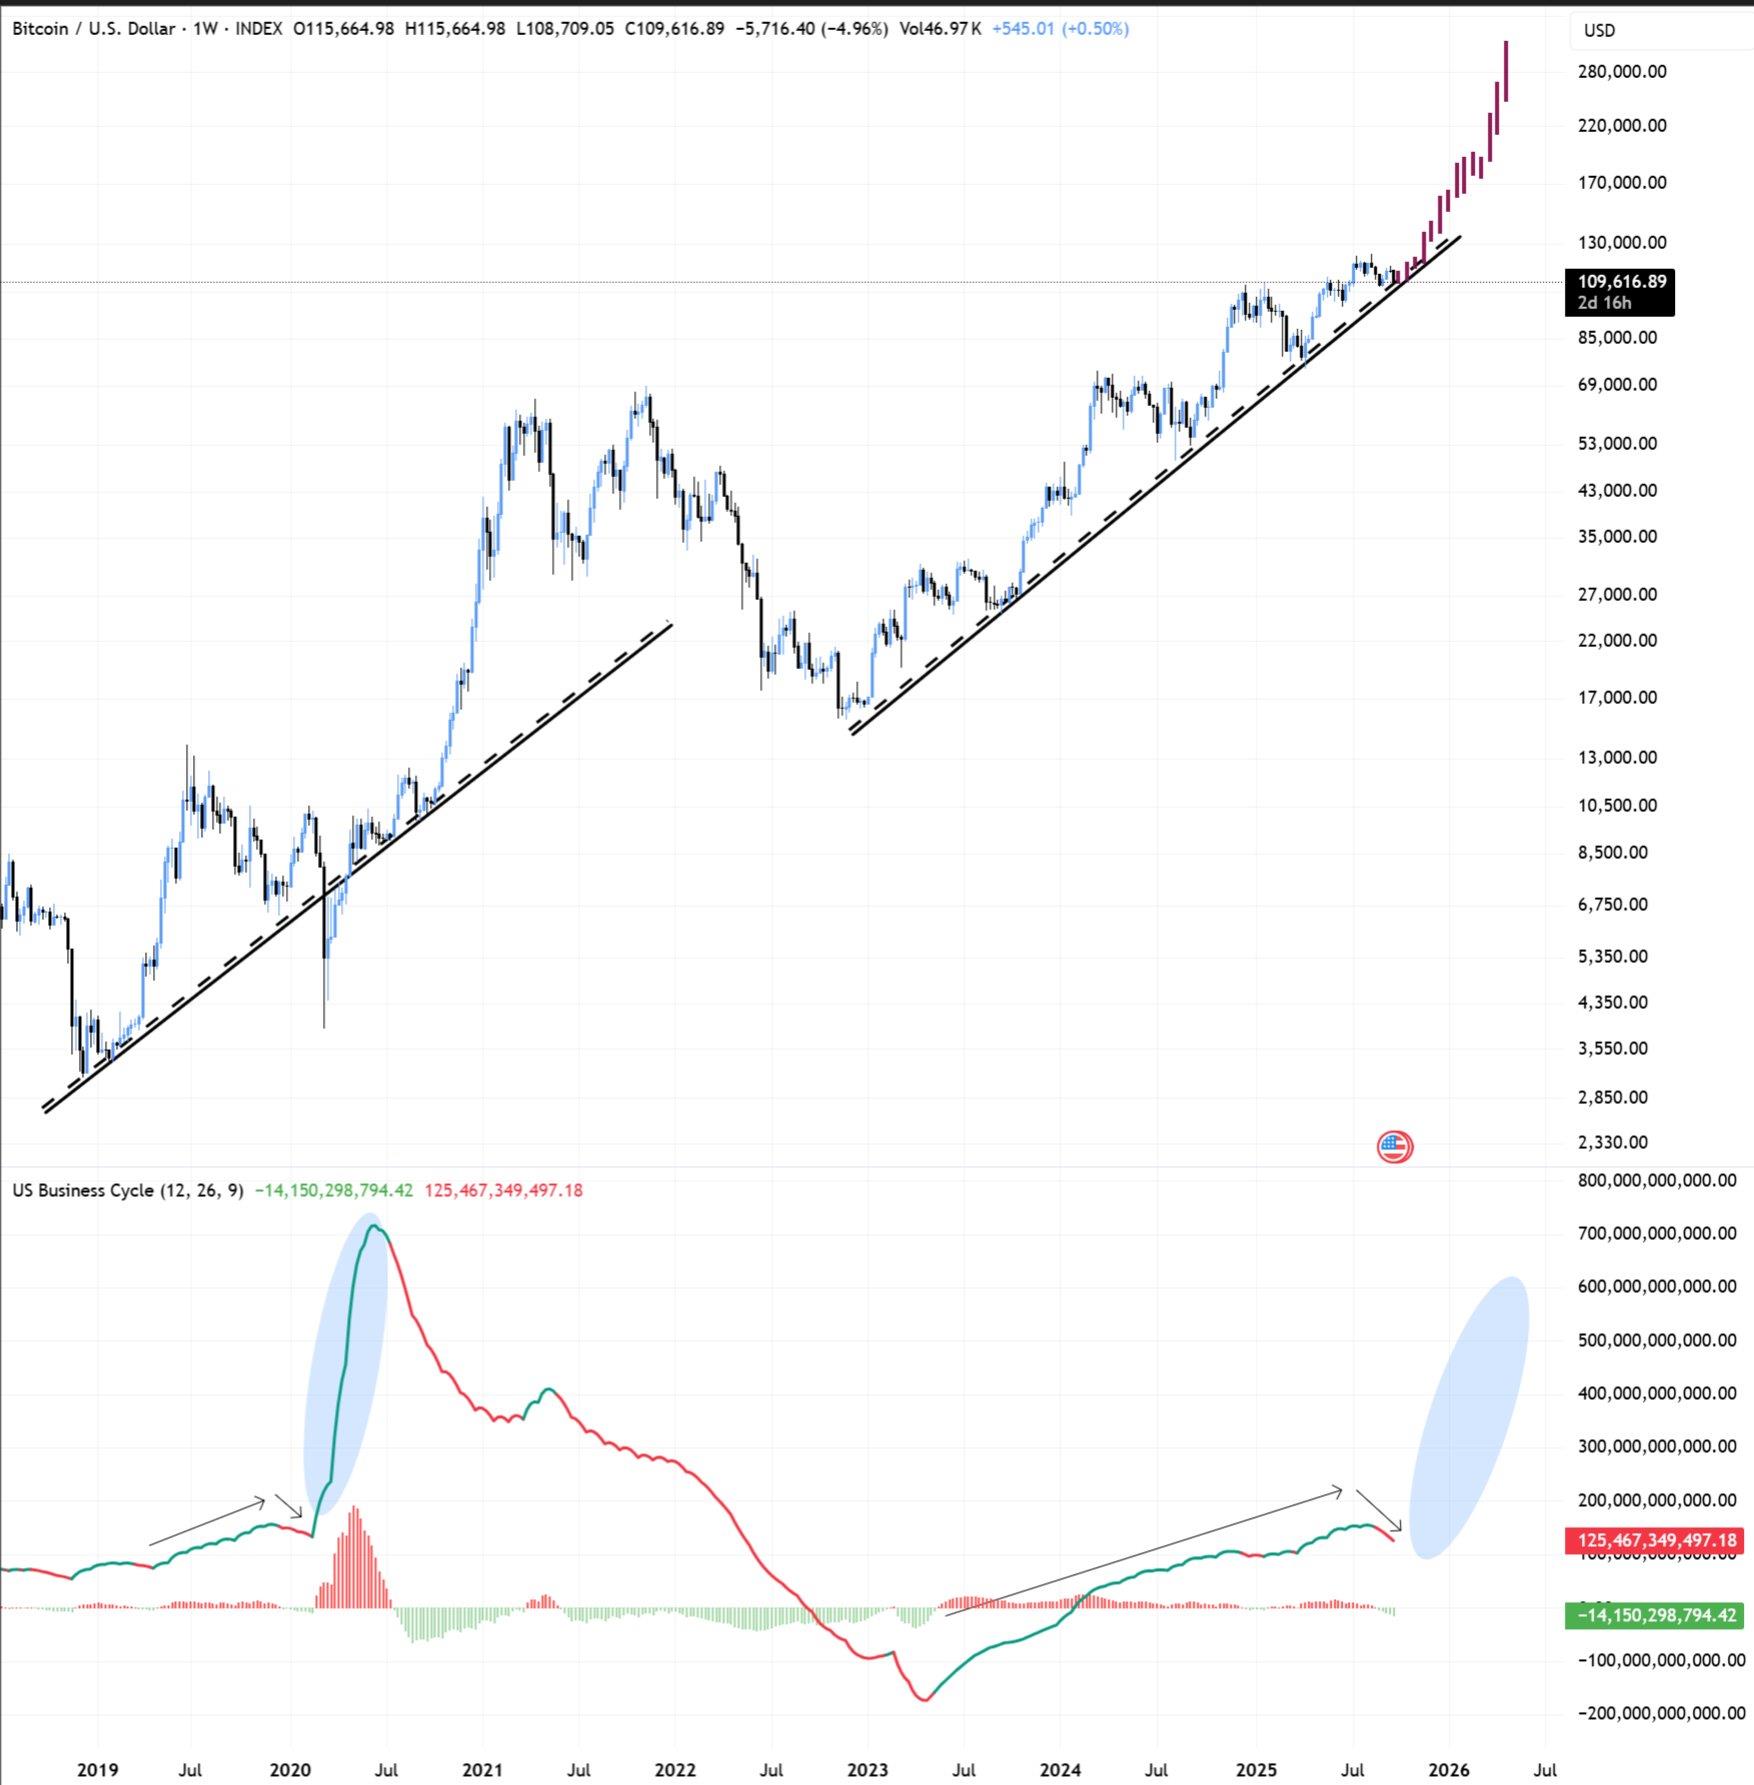
BTC/USD weekly price chart. Source: Bitbull/TradingView
With the Federal Reserve’s recent interest rate cuts, some experts believe Bitcoin could see further upside over the next three to four months, potentially reaching as high as $140,000. Analyst Captain Faibik argues that current dips represent a healthy correction. A breakout above $113,000, especially if accompanied by a bullish flag pattern, could spark a rally toward $140,000 in the coming months.

BTC/USD daily price chart. Source: Captain Faibik/TradingView
Many experts have projected similar year-end targets for Bitcoin, with some analysts speculating on macro tops in the $150,000 to $200,000 range. As Bitcoin continues to navigate macroeconomic shifts and evolving regulation, the next few months will be crucial in determining whether the current dip is merely a correction or the start of a sustained downturn in the crypto markets.
This analysis is for informational purposes only and does not constitute financial advice. Cryptocurrency investments involve risk, and market participants should conduct thorough research before making trading decisions.
Crypto Investing Risk Warning
Crypto assets are highly volatile. Your capital is at risk. Don’t invest unless you’re prepared to lose all the money you invest.
MENAFN28092025008006017065ID1110119863
Images are for reference only.Images and contents gathered automatic from google or 3rd party sources.All rights on the images and contents are with their legal original owners.
Aggregated From –
Comments are closed.