Our Terms & Conditions | Our Privacy Policy
Updates on Four Factors
- OPEC+ blinks
- Chinese energy demand sinks
- Hedge funds holding large short positions
- Supply & demand at work in natural gas market
Sincerely,
David Thompson, CMT
Executive Vice President
Powerhouse
(202) 333-5380
The Matrix
Two months ago, the Weekly Energy Market Situation highlighted four critical factors to keep tabs on. This week’s note will update the status of those themes along with an extra bonus issue.
First on the list, OPEC+ has delayed its decision to bring back previously withheld oil production until at least December ’24. Recall that back in June, OPEC members decided to return 2.2 million barrels per day of voluntary cuts. They reiterated a commitment to this course of action in their September meeting. Continued weak Chinese oil demand data (#2 on our watch list) appears to have been the prime factor in their change of course. Some bank analysts believe that OPEC+ will not bring back supply until well into 2025.
Chinese energy demand has remained weak. The Chinese Purchasing Managers Index (PMI) slipped further below the 50-level indicating recessionary expectations. Weaker domestic demand and weather disruptions have been cited as the causes. Some analysts are now openly worrying about a deflationary cycle in China. The effect of this cycle may well be transmitted to many of the major developed market (DM) economies because of the linkages of international trade. One analyst said of Chinese policy efforts, “Despite the early signs of some shift in tone from Beijing, it is hard to imagine a meaningful change in direction for policy and subsequently the economy any time soon. So, the disinflationary implications for DM economies are set to continue at least into the first half of next year.”
Regarding the third and fourth factors, some U.S. refiners are cutting back on refinery runs. Some have cited the need to enact repairs after storms. In the current low crack spread environment, purely economic run cuts are not out of the question. Last week, the EIA indicated that U.S. refiners were operating about 1.0% lower than year ago levels. U.S. gasoline demand, in contrast, remains slightly ahead of year-ago levels.
The bonus issue is the extremely bearish positioning of money managers as reflected in the Commitment of Traders report. Brent, diesel and gasoline net-short positions by large financial traders have now reached truly historic levels. At some point, something will trigger the funds to exit their positions. When that occurs, with such a large short position to address, the resulting short-covering rally could be significant.
Supply/Demand Balances
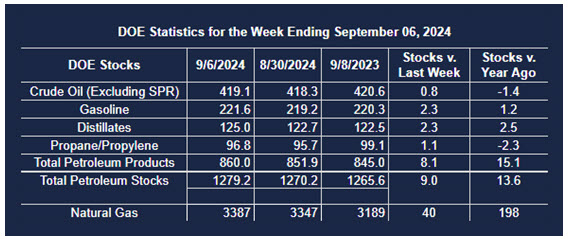
Supply/demand data in the United States for the week ending September 6, 2024, were released by the Energy Information Administration.
Total commercial stocks of petroleum increased () 9 million barrels to 1.2792 billion barrels during the week ending September 6th, 2024.
Commercial crude oil supplies in the United States were higher () by 0.8 million barrels from the previous report week to 419.1 million barrels.
Crude oil inventory changes by PAD District:
PADD 1: Up () 0.2 million barrels to 7.9 million barrels
PADD 2: Down () 2.4 million barrels to 101.7 million barrels
PADD 3: Down () 4.6 million barrels to 239.0 million barrels
PADD 4: Down () 0.5 million barrels to 21.9 million barrels
PADD 5: Down () 0.9 million barrels to 48.7 million barrels
Cushing, Oklahoma, inventories were down () 1.7 million barrels to 26.4 million barrels.
Domestic crude oil production remained unchanged (=) at 13.3 million barrels per day.
Crude oil imports averaged 6.867 million barrels per day, a daily increase () of 1,075,000 barrels. Exports decreased () 451,000 barrels daily to 3.305 million barrels per day.
Refineries used 92.8 percent of capacity; a decrease () of 0.5 percent from the previous report week.
Crude oil inputs to refineries decreased () 141,000 barrels daily; there were 16.759 million barrels per day of crude oil run to facilities. Gross inputs, which include blending stocks, decreased () 88,000 barrels daily to 17.011 million barrels daily.
Total petroleum product inventories increased () by 8.2 million barrels from the previous report week, up to 860.1 million barrels.
Total product demand decreased () 1,158,000 barrels daily to 19.383 million barrels per day.
Gasoline stocks increased () 2.3 million barrels from the previous report week; total stocks are 221.6 million barrels.
Demand for gasoline decreased () 460,000 barrels per day to 8.478 million barrels per day.
Distillate fuel oil stocks increased () 2.3 million barrels from the previous report week; distillate stocks are at 125.0 million barrels. EIA reported national distillate demand at 3.558 million barrels per day during the report week, a decrease () of 439,000 barrels daily.
Propane stocks rose () 1.1 million barrels from the previous report to 96.8 million barrels. The report estimated current demand at 823,000 barrels per day, an increase () of 94,000 barrels daily from the previous report week.
Natural Gas
The combined effects of reduced supply and increased demand have done an impressive job of reducing excess natural gas inventory levels. Storage is still running about 10% above the 5-year average but producers have throttled back production by about 4.5 bcf/day since the February peak in production. At the same time, summer degree day accumulation is running about 6% ahead of normal. This has led to power burns running 3.5% more than year-ago levels.
Front-month natural gas futures prices are at the upper end of a range that has seen prices oscillating between $1.85 and $2.40. Should price break through the upper bound, a technical push-up to the $2.85 – $2.95 zone might be possible.
According to the EIA:
- Net injections into storage totaled 40 Bcf for the week ending September 6, compared with the five-year (2019–2023) average net injections of 67 Bcf and last year’s net injections of 50 Bcf during the same week. Working natural gas stocks totaled 3,387 Bcf, which is 296 Bcf (10%) more than the five-year average and 198 Bcf (6%) more than last year at this time.
- According to The Desk survey of natural gas analysts, estimates of the weekly net change to working natural gas stocks ranged from net injections of 29 Bcf to 68 Bcf, with a median estimate of 46 Bcf.
- The average rate of injections into storage is 23% lower than the five-year average so far in the refill season (April through October). If the rate of injections into storage matched the five-year average of 11.3 Bcf/d for the remainder of the refill season, the total inventory would be 4,008 Bcf on October 31, which is 296 Bcf higher than the five-year average of 3,712 Bcf for that time of year.
Was this helpful? We’d like your feedback.
Please respond to [email protected]
This material has been prepared by a sales or trading employee or agent of Powerhouse Brokers, LLC and is, or is in the nature of, a solicitation. This material is not a research report prepared by Powerhouse Brokers, LLC. By accepting this communication, you agree that you are an experienced user of the futures markets, capable of making independent trading decisions, and agree that you are not, and will not, rely solely on this communication in making trading decisions.
DISTRIBUTION IN SOME JURISDICTIONS MAY BE PROHIBITED OR RESTRICTED BY LAW. PERSONS IN POSSESSION OF THIS COMMUNICATION INDIRECTLY SHOULD INFORM THEMSELVES ABOUT AND OBSERVE ANY SUCH PROHIBITION OR RESTRICTIONS. TO THE EXTENT THAT YOU HAVE RECEIVED THIS COMMUNICATION INDIRECTLY AND SOLICITATIONS ARE PROHIBITED IN YOUR JURISDICTION WITHOUT REGISTRATION, THE MARKET COMMENTARY IN THIS COMMUNICATION SHOULD NOT BE CONSIDERED A SOLICITATION.
The risk of loss in trading futures and/or options is substantial and each investor and/or trader must consider whether this is a suitable investment. Past performance, whether actual or indicated by simulated historical tests of strategies, is not indicative of future results. Trading advice is based on information taken from trades and statistical services and other sources that Powerhouse Brokers, LLC believes are reliable. We do not guarantee that such information is accurate or complete and it should not be relied upon as such. Trading advice reflects our good faith judgment at a specific time and is subject to change without notice. There is no guarantee that the advice we give will result in profitable trades.
Copyright 2024 Powerhouse Brokers, LLC, All rights reserved
Images are for reference only.Images and contents gathered automatic from google or 3rd party sources.All rights on the images and contents are with their legal original owners.
Aggregated From –
Comments are closed.