



Original Coverage & Source Attribution: cryptonews.net
The immediate support sits at $0.07486, a level that could determine $DOGE’s next direction. A daily close below this threshold could encourage further selling. Hence, traders may watch for additional weakness if buyers fail to defend this zone.
However, a recovery could begin if $DOGE reclaims resistance between $0.08183 and $0.08222. This area combines the 20-day EMA and Fibonacci resistance. Moreover, the $0.08432-08463 range presents another obstacle near the 50-day and 100-day EMAs.
$DOGE’s Bollinger Bands %B reading stands at 0.16, placing its price near the indicator’s lower band. This position reflects selling pressure, although buyers could attempt a short-term rebound. Significantly, the $0.09117 level remains a distant recovery target near the 200-day EMA.
MemeCore Price Prediction: Can M Break Above $1.01?
MemeCore presents a stronger short-term picture after rebounding from support near $0.66687. The token has climbed 7.29% to approximately $0.99666, recovering above its 20-day EMA at $0.90670.
Additionally, M has reclaimed the $0.92869 Fibonacci level, suggesting renewed buying interest. Its immediate challenge lies at $1.01140, where the 50-day EMA could restrict further gains.
A sustained daily close above this resistance could strengthen the recovery. Consequently, traders may monitor $1.09067 as the next upside target, followed by $1.22158. These levels would represent further progress if buying momentum continues.
However, MemeCore still trades below its 100-day and 200-day EMAs. Its Bollinger Bands %B reading of 0.78 indicates improving momentum, but the broader trend requires further confirmation.
On the downside, $0.92869 and $0.90670 provide nearby support. A break below both levels could weaken the recovery and expose the $0.80 area. Moreover, the previous low near $0.66687 remains a critical support reference.
Shiba Inu Price Prediction: $SHIB Risks Further Weakness
Shiba Inu trades around $0.00000486 after declining 1.42%, extending its bearish daily-chart structure. The token continues to form lower highs and lower lows beneath a descending trendline.
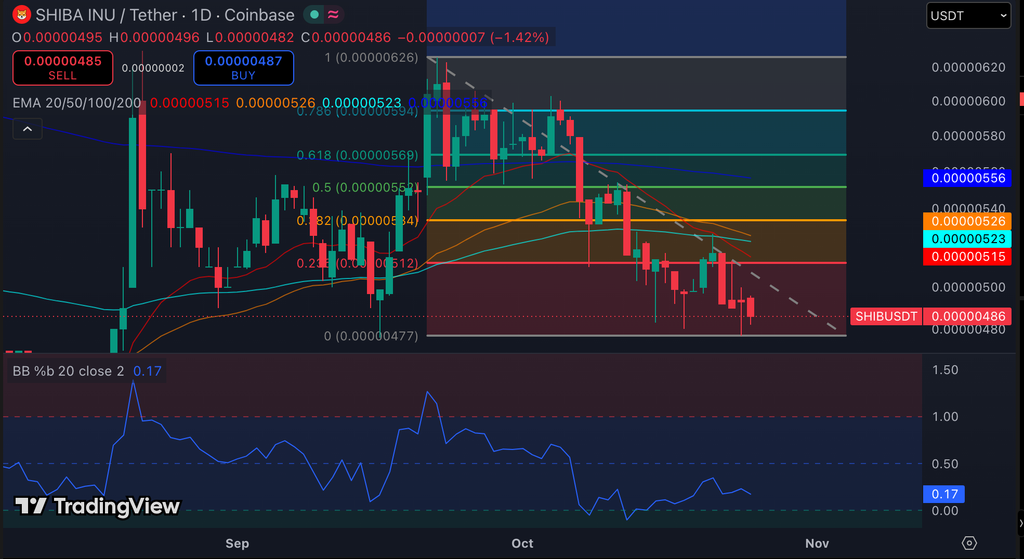
$SHIB also remains below its four major EMAs. The 20-day EMA near $0.00000515 offers immediate resistance, while the 50-day and 100-day EMAs cluster around $0.00000523-00000526. Additionally, the 200-day EMA near $0.00000556 represents a stronger barrier.
The Bollinger Bands %B indicator stands at 0.17, indicating that $SHIB trades near the lower end of its recent range. Nevertheless, a short-term rebound remains possible if buyers regain control.
$SHIB needs to reclaim $0.00000512-00000515 to begin challenging its bearish structure. A breakout could open the way toward $0.00000534. Conversely, losing support around $0.00000477-00000480 could expose $SHIB to further declines.