


India’s Happiness Slump: A Decade of Decline, a Partial Recovery—and Questions GDP Cannot Answer
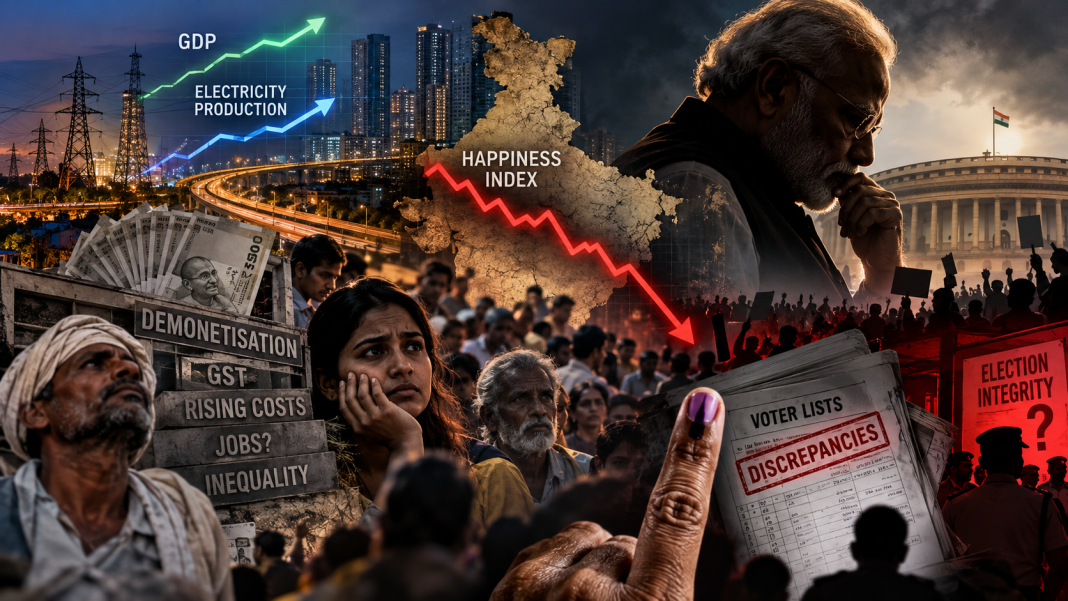
India’s economy and electricity system have grown substantially. Yet World Happiness Report data show a long decline in life evaluations, a trough in the 2020 report, and a recovery that still sits below the 2010–12 reading. The timing overlaps disruptive economic reforms and wider social and political stresses; the data demand scrutiny, not a simplistic claim that any one event explains the trend.
Since Narendra Modi’s BJP-led government took office in May 2014, India has expanded its economy, power infrastructure and digital systems. Those are measurable achievements. Yet the public-interest test is broader: have economic gains translated into secure livelihoods and better everyday lives—and can citizens trust that the electoral rolls used to choose their representatives are accurate, inclusive and auditable?
This analysis connects the timing of the happiness decline to the public record—especially the 2016 demonetisation shock, the 2017 GST rollout, and later political and pandemic-era stresses—while separating documented events from causal claims. The World Happiness Report does not identify a single event as the cause of India’s decline. The article also reviews electoral-roll and political-finance controversies, distinguishing verified findings, reported allegations and matters that remain unproven.
At a glance
- Utility electricity generation rose from about 1,027 billion units (BU) in FY 2013–14 to 1,824 BU in FY 2024–25—an increase of roughly 78%, according to CEA figures cited by NITI Aayog.
- Real GDP rose substantially over the same broad period. The comparison below uses the published series with a 2011–12 base year; India introduced a new 2022–23 base-year series in 2026, so the series should not be mixed without a consistent back-series.
- The score fell from 4.772 in the World Happiness Report 2013 (survey years 2010–12) to a low of 3.573 in the 2020 edition, before recovering to 4.536 in the 2026 edition. The latest score remains about 5% below the 2010–12 reading; its latest rank is 116 of 147.
- Reuters reported that around 130 million electoral-roll entries had been removed across a large voter-verification exercise. The Election Commission says the entries related to factors such as death, relocation, duplication and inability to trace voters; opposition parties allege that the process risks wrongful exclusion.
Chart 1: Growth in output and electricity has not translated into a comparable rise in reported happiness
India’s progress indicators, indexed to 100 at the baseline
| Indicator | Baseline | Latest endpoint | Change | Visual comparison (index) |
|---|---|---|---|---|
| Real GDP | 100 | 191 | About +91% | Baseline: ██████████ 100 Latest: ███████████████████ 191 |
| Electricity generation | 100 | 178 | About +78% | Baseline: ██████████ 100 Latest: ██████████████████ 178 |
| Happiness score | 100 | 99.4 | About −0.6% | Baseline: ██████████ 100 Latest: ██████████ 99.4 |
How to read this: This is an endpoint comparison, not an annual trend line. GDP and electricity data use financial years; happiness scores use survey averages reported in different editions. Sources: Government of India national accounts estimates, NITI Aayog citing Central Electricity Authority figures, and World Happiness Reports 2015 and 2026. GDP series · NITI Aayog power analysis · WHR 2015 · WHR 2026.
How to read this: the indexed GDP calculation uses ₹98.39 lakh crore for FY 2013–14 and ₹187.97 lakh crore for FY 2024–25 from the previously published constant-2011–12-price series (approximately +91%). Electricity generation rises from 1,027 BU to 1,824 BU (approximately +78%). The happiness-score index compares 4.565 with 4.536 (approximately −0.6%). This deliberately compares endpoints only; it does not imply that the lines followed a straight path. India’s 2026 GDP base-year revision means future long-run comparisons should use the forthcoming consistent back-series.
The happiness timeline: the decline began before 2014, deepened during the reform years, then partially recovered
The most important part of the story is hidden by a start-versus-finish comparison. India’s life-evaluation score did not move in a straight line. It fell across several World Happiness Report editions, hit a low in the 2020 edition, and then recovered. The latest score is better than the trough—but it remains below the score reported for the 2010–12 survey period.
India’s World Happiness Report score by report edition
| Report edition | Life-evaluation score | Visual level (0–5 scale) |
|---|---|---|
| 2013 | 4.772 | ███████████████████ |
| 2015 | 4.565 | ██████████████████ |
| 2016 | 4.404 | ██████████████████ |
| 2017 | 4.315 | █████████████████ |
| 2018 | 4.190 | █████████████████ |
| 2019 | 4.015 | ████████████████ |
| 2020 | 3.573 | ██████████████ |
| 2021 | 3.819 | ███████████████ |
| 2022 | 3.777 | ███████████████ |
| 2023 | 4.036 | ████████████████ |
| 2024 | 4.054 | ████████████████ |
| 2025 | 4.389 | ██████████████████ |
| 2026 | 4.536 | ██████████████████ |
Reading the timeline: The score declined from 4.772 in the 2013 edition to a low of 3.573 in the 2020 edition, then recovered to 4.536 in the 2026 edition. The latest score remains below the 2010–12 reading. Scores are based on pooled survey data, generally over the preceding three years, and do not prove that a single event caused a change. Sources: World Happiness Report 2013 and World Happiness Report 2026.
The broadest finding is not merely that the latest score is low. The World Happiness Report’s 2019 analysis found that India’s life evaluations had fallen by more than 1.1 points when comparing the 2005–08 period with 2016–18. The report also noted that South Asia’s life evaluations moved downward while those in East and Southeast Asia generally rose. Its authors cautioned that the usual six explanatory factors did not fully account for these changes, and that aggregate data cannot establish simple cause and effect. Read the report’s analysis of changing world happiness.
What was happening while the score fell?
| Period / report reading | Context in the public record | What can—and cannot—be inferred |
|---|---|---|
| 2010–12 WHR 2013: 4.772 |
This is the early reference point, before the BJP-led Union government took office in May 2014. The longer decline therefore did not begin with Modi’s government. | Important baseline. It prevents the entire long-run fall from being assigned to a government that had not yet taken office. |
| 2014–16 WHR 2015–17: 4.565 → 4.315 |
The BJP-led government began in May 2014. In November 2016, the government withdrew high-denomination banknotes, causing a sudden cash shortage and disrupting consumption and business activity. The IMF described the cash shock as a temporary drag on growth, with smaller businesses and rural areas particularly affected. | The decline overlaps the early years of the government and the demonetisation period. The score is based on pooled surveys and does not prove that demonetisation caused a specific fall in happiness. |
| 2017–18 WHR 2018–19: 4.190 → 4.015 |
GST took effect on 1 July 2017. The IMF later said the disruption around demonetisation and GST rollout was associated with a slowdown to 6.7% GDP growth in FY 2017–18; it also described GST transition costs and uncertainty for businesses. | This is relevant economic context during the sustained happiness decline. It supports scrutiny of reform design and implementation, not a claim that the reforms alone explain life-evaluation scores. |
| 2019 WHR 2020: 3.573 |
The survey window for the 2020 report covers 2017–19, a period that includes the 2019 general election and major political events later that year. The score should not be explained by COVID-19 lockdowns, which began in 2020, after this survey window. | The low reading predates the pandemic. The report does not isolate the effects of individual political events, so claims assigning the score to one event need further evidence. |
| 2020–22 WHR 2021–23: 3.819 → 4.036 |
Survey windows now overlap with the COVID-19 pandemic and its economic and social disruption. The published scores fluctuated rather than showing a one-directional pandemic effect. | COVID-era conditions form part of the context, but these national averages do not isolate how much of the movement came from the pandemic versus other influences. |
| 2023–25 WHR 2026: 4.536 |
India’s score has recovered from the 2020-edition low, moving upward across recent reports. | This recovery matters. But 4.536 remains 0.236 points (about 5%) below the 4.772 score for 2010–12. Improvement from the trough does not mean the earlier level has been regained. |
The timing raises serious questions—but correlation is not proof
The decline and its timing warrant scrutiny because the score deteriorated over years in which India experienced major economic and policy changes. The most defensible criticism is specific: the government should explain how its reforms were designed to protect informal workers, small businesses and household confidence during disruption, and should evaluate success using employment quality, real purchasing power and well-being alongside GDP.
There are limits to what the happiness data establish. World Happiness Report scores are averages of people’s self-reported life evaluations; report rankings generally pool three years of surveys. They are not a monthly tracker, a vote on the ruling party, or evidence of a deliberate plan to make people less happy. The score began falling before May 2014, and a number of later events overlap with the survey windows. That is why the article distinguishes a documented trajectory from a causal claim that has not been proven.
Still, the fact that India’s life-evaluation score plunged during the 2010s, even as national output expanded, is a public-policy question that cannot be dismissed by citing GDP growth alone. The latest improvement should be welcomed—but the government should not present recovery from a low point as if it erased the decline or returned the country to its earlier well-being level.
The economy is bigger—but the size of GDP is not the same as household security
India’s expansion is real. Under the older official constant-price series, GDP rose from ₹98.39 lakh crore in FY 2013–14 to ₹187.97 lakh crore in FY 2024–25. That is a substantial increase in real output, rather than merely a rise caused by inflation. However, the Ministry of Statistics introduced a new GDP series with a 2022–23 base year in February 2026. The ministry says a consistent back-series is expected later in 2026, so the older series should be labelled clearly rather than silently spliced into the new one. See the Ministry’s explanation of base-year revisions.
GDP is a measure of economic production—not a direct measure of the money left in an average household’s account after rent, food, fuel, education and medical bills. Nor does it reveal whether new jobs are secure, formal and well paid.
Some indicators challenge the most pessimistic account of the period. The World Bank’s June 2025 update, using revised international poverty lines and new Indian household-consumption survey data, estimated that extreme poverty at the $3-per-person-per-day line fell from 27.1% in 2011–12 to 5.3% in 2022–23. The same update estimates 2.3% under a lower $2.60 line. These are substantial reductions, but the World Bank also explains that revisions to purchasing-power parities, the poverty threshold and survey methodology changed the estimates. This trend should not be treated as a simple measure of the BJP government’s impact alone. Read the World Bank methodology note.
The labour-market picture is also more complicated than a single unemployment number. The government’s Periodic Labour Force Survey reported a 3.2% usual-status unemployment rate for people aged 15 and above in July 2023–June 2024, while female labour-force participation rose to 41.7%. Those are relevant positive indicators. But the unemployment rate alone does not reveal underemployment, informal work, pay adequacy, job stability or whether workers can afford essential services. Source: MoSPI, PLFS 2023–24.
The scrutiny question, therefore, is not whether India has grown. It is whether the gains are broad enough—and whether public policy is improving the quality, security and purchasing power of ordinary lives at the pace citizens have been led to expect.
Electricity: a major expansion, with reliability and cost still to prove
According to NITI Aayog’s power-sector analysis, utility electricity generation increased from 1,027 BU in FY 2013–14 to an estimated 1,824 BU in FY 2024–25. The same analysis notes that renewable energy’s share of actual utility generation rose from 19.6% to about 22% over that period, despite much faster growth in installed renewable capacity. Solar and wind output varies with weather and time of day; transmission, storage and flexible generation are necessary to turn nameplate capacity into dependable supply. Source: NITI Aayog.
This is simultaneously an achievement and a warning. More generation supports industry, urban development, cooling and digital services. But installed capacity is not the same as reliable electricity available at the moment of peak demand. The system must be able to deliver power through heatwaves, weak hydropower seasons, fuel constraints and evening demand peaks without passing avoidable costs on to consumers.
That challenge is not theoretical. Reuters reported on 6 October 2026 that India’s electricity shortage reached 560 million units in September, the highest since August 2023, amid weaker hydropower generation, coal-plant maintenance and limited battery storage. Nearly 41 GW of plants were reported offline and about 47% of coal plants had critical fuel stocks. A single month does not invalidate a decade of expansion. It does, however, underline why reliability and storage should be judged alongside installed capacity. Reuters, 6 October 2026.
The next test is whether the government can integrate more renewables while maintaining affordable, dependable power. That requires investments in storage and transmission, better demand forecasting, available firm generation and distribution companies able to maintain the network without accumulating unsustainable losses.
Household costs and taxes: economic growth must be felt in purchasing power
For households, the relevant calculation is disposable income after essentials. Food prices, rent, transport, health care, education and electricity bills can make a growing economy feel far less prosperous to people whose wages do not keep pace with costs.
| Cost / revenue indicator | Earlier comparison point | Latest comparison point | What it shows |
|---|---|---|---|
| Petrol price, Delhi | ₹72.26 per litre (1 April 2014) | ₹102.12 per litre (1 October 2026) | About 41% higher in nominal rupees; not adjusted for inflation. |
| Total petroleum-sector contribution to central and state exchequers | ₹3.33 lakh crore (FY 2014–15) | ₹7.58 lakh crore (FY 2024–25) | About 128% higher in nominal terms; this broader total includes duties, royalties, direct taxes and other receipts, not fuel taxes alone. |
These comparisons establish that petrol became more expensive in nominal terms and that petroleum-related receipts to government increased substantially. They do not prove that tax increases alone caused the full rise: crude prices, exchange rates, marketing margins, state tax policy and consumption volumes also matter. The PPAC’s historical price table records Delhi petrol at ₹72.26 per litre on 1 April 2014; its October 2026 price notices listed ₹102.12. The PPAC’s petroleum-sector exchequer series records ₹3.326 lakh crore in FY 2014–15 and ₹7.582 lakh crore in FY 2024–25. Historical petrol prices · October 2026 retail price notices · Petroleum-sector contribution to the exchequer.
India’s tax reforms have had mixed effects. The Goods and Services Tax created a more unified national indirect-tax framework and has expanded formal tax collection. Yet its implementation imposed adjustment and compliance burdens on many small firms, and tax complexity has not disappeared. Petrol and diesel also remain outside the standard GST structure, with central excise and state VAT continuing to affect retail prices. Fuel taxes provide revenue, but they can increase commuting and freight costs, with knock-on effects for household budgets.
Tax collections alone do not tell us whether citizens are paying too much or receiving sufficient public value. A serious evaluation should compare the tax burden across income groups with the quality and accessibility of the services those revenues finance: public hospitals, schools, public transport, energy infrastructure and social protection.
The government’s most defensible economic case is that infrastructure, digital public services, payments systems and welfare delivery have improved in important ways. Its strongest accountability challenge is to show that these gains translate into real wages, secure jobs, affordable essentials and fair access—not only higher aggregate output and revenue collections.
Beyond the happiness score: human development and the quality of everyday life
A happiness score cannot diagnose every social problem. It does, however, ask a different question from GDP: how do people themselves evaluate the lives they are living? The World Happiness Report examines six factors that help explain differences between countries—income, social support, healthy life expectancy, freedom to make life choices, generosity and perceptions of corruption. The report’s own analysis warns that these variables do not fully explain India’s earlier decline.
Human development, labour-market quality, access to health care, affordability of education and housing, reliable energy, and confidence in institutions should therefore be studied together. A government can point to new infrastructure and higher output while still facing legitimate questions about whether people feel safe, secure, supported and able to improve their lives.
International assessments also raise governance concerns. Reporters Without Borders ranked India 157th of 180 countries in its 2026 World Press Freedom Index. That is an external watchdog’s assessment, not a measure of GDP, but press freedom and the ability to scrutinise those in power are relevant to democratic accountability. Source: Reporters Without Borders.
Electoral rolls under scrutiny: what is documented—and what remains unproven
Election integrity is now a central part of India’s public-accountability debate. Reuters reported on 9 October 2026 that around 130 million entries had been removed during a large voter-verification exercise. The categories cited from Election Commission data were approximately 63 million people recorded as having relocated, 30 million who could not be traced, 28 million reported deceased and 10 million duplicate entries. These category figures are rounded, which is why they do not add up exactly to the headline total.
The Commission says the revision is intended to remove entries for legitimate administrative reasons and maintains that voters can seek inclusion or appeal. Opposition parties and campaigners argue that the process risks excluding eligible voters, particularly where documentation, relocation or the correction process creates barriers. The headline figure must not be described as 130 million proven eligible voters unlawfully disenfranchised; the public evidence does not establish that. But at this scale, transparent reasons, accessible appeals and independent checks are indispensable. Reuters, 9 October 2026.
Reported categories in the voter-roll verification exercise
| Reported category | Approximate entries | Visual comparison |
|---|---|---|
| Relocated | 63 million | ████████████████████ |
| Could not be traced | 30 million | ██████████ |
| Reported deceased | 28 million | █████████ |
| Duplicate entries | 10 million | ███ |
These are rounded categories reported by Reuters citing Election Commission data—not independently confirmed counts of eligible voters improperly excluded. Source: Reuters.
A documented system error in Maharashtra
The Indian Express reported that a technical glitch caused the birth year of 270,313 Maharashtra voters to appear as 1900, making them appear to be between 101 and 150 years old in a draft electoral roll. The error was corrected on 6 October after state officials had raised the issue more than a month earlier. The report also said the draft roll contained 7.72 crore electors, down from 9.79 crore before the revision, with claims and objections due by 12 October and the final roll scheduled for 16 November.
This is evidence of a serious data-quality failure and an administrative process that took time to correct. It is not, on its own, proof that votes were fabricated or that a past election result was altered. The proper question is whether similar errors are found elsewhere, how many eligible voters were affected, how quickly corrections are made, and whether independent auditors can inspect the relevant records. Read the reported Maharashtra case.
A High Court has questioned the risk of excluding eligible voters
On 6 October, the Bombay High Court at Goa questioned the voter-roll procedure while hearing a petition involving six family members whose names had been deleted after problems with address-change applications. The court raised concerns about a procedural “Catch-22” and the requirement to hear a voter before removing a name from an existing roll. This was a court hearing about a particular petition, not a final ruling that the entire nationwide revision was unlawful. It nevertheless raises a concrete due-process issue that election authorities should answer publicly. Read the court report.
What about claims of fraud in the 2024 general election?
Discrepancies in the 2026 voter-roll revision are a legitimate reason to demand audits, publication of records and accessible remedies. They do not automatically establish fraud in the 2024 Lok Sabha election, whose results are a separate factual and legal question. To substantiate a claim that the national government was fraudulently installed, investigators would need specific, verifiable evidence linking unlawful acts to voter eligibility, counting or the certified result—and a competent inquiry or court would need to assess it. This article has not identified a final judicial finding that the 2024 national result was fraudulent.
That does not mean the Election Commission should be beyond scrutiny. It means the scrutiny should be precise. A credible audit would publish constituency-level changes in voter rolls; document the reasons and timing for deletions; compare additions, deletions and restoration requests; record how many eligible voters were restored before polling; allow independent sampling of disputed entries; and disclose the treatment of complaints in a form that protects citizens’ personal data.
Reuters reported on 10 October that police detained more than 2,000 people during a protest demanding the resignation of the Chief Election Commissioner, with parts of Delhi locked down and mobile internet suspended in the central business district. That reporting documents a significant confrontation over electoral accountability. Detentions and protests are not proof of election fraud, but the state’s handling of public dissent is itself a matter of democratic scrutiny. Nor do protests or resignation demands establish that the Union government is about to fall; the reporting reviewed here does not substantiate that prediction. Reuters, 10 October 2026.
Transparency has to include political money
Electoral integrity is not limited to the voter list. In February 2024, India’s Supreme Court declared the Electoral Bond Scheme unconstitutional, holding that nondisclosure of political contributions violated citizens’ right to information and that provisions permitting unlimited corporate political contributions were arbitrary. This is a documented constitutional finding about political-finance transparency. It is not a judicial finding that the 2024 election result was fraudulent, but it does demonstrate why transparency in the financing of political competition is essential. Read the Supreme Court order and judgment materials.
Global standing: greater economic weight, unresolved democratic concerns
India’s economic scale and strategic relevance have increased, and it remains a major power in Asia. A claim that the country has declined in every global measure would be too broad. At the same time, international press-freedom assessments remain poor: Reporters Without Borders placed India at 157th of 180 in 2026. That contrast matters because a country’s global influence is strengthened not just by its market size or military capacity, but also by trusted institutions, open scrutiny and reliable legal safeguards.
The underlying question is whether India can combine rapid growth with stronger public institutions. A country can build more infrastructure and still need better protections for journalists, opposition voices and citizens challenging official decisions. These are not competing ambitions; they are parts of a durable development model.
What a credible accountability programme should demand
- Publish auditable voter-roll change logs. Provide constituency-level totals for additions, deletions, duplicate resolution, appeals and restored entries, with reasons and dates, while protecting personal information.
- Commission an independent data-quality audit. Review the systems used to change rolls, the access available to state and local election officers, and the process for identifying and correcting large anomalies.
- Guarantee an effective remedy. An eligible voter must be able to check status, contest deletion and restore registration without impossible documentation loops or unclear deadlines.
- Publish election-integrity evidence in a testable form. Specific allegations should be supported by records, reproducible analysis and defined affected constituencies—not only viral claims or unexplained arithmetic.
- Judge economic performance by outcomes households feel. Report real wages, job quality, essential-cost burdens, reliable electricity, health and education access alongside GDP, investment and installed capacity.
Conclusion: a partial happiness recovery does not erase a decade of lost ground
India’s economic output and electricity generation have increased substantially since the 2013–14 baseline. Poverty estimates show meaningful progress, and labour-force indicators also contain improvements. But the happiness timeline complicates the success story: the score fell through several report editions, reached its low in the 2020 edition, and has since recovered to 4.536. That is still below the 4.772 score reported for the 2010–12 survey period. Growth in output is not, by itself, proof that citizens experienced an equivalent improvement in their lives.
The electoral-roll dispute makes the accountability question more urgent. A revision involving tens of millions of entries cannot rely on assurances alone. The Election Commission should provide transparent, independently testable evidence that legitimate removals are accurately classified and that every eligible voter has a practical route to remain registered. Documented system errors and court concerns merit investigation; allegations of partisan manipulation require proof; and claims that an election result was fraudulent should not be declared established without evidence that supports that conclusion.
The standard should be consistent whoever benefits politically: accurate rolls, accountable administration, open political financing, reliable public data and meaningful remedies for citizens. On well-being, the question is equally concrete: why did life evaluations fall so sharply during the 2010s, why did the decline continue across overlapping economic and political stresses, and what changed to produce the subsequent recovery? The available evidence makes these questions unavoidable, but does not justify a single-cause or conspiracy claim. India’s progress should be judged not only by how large its economy becomes, but by whether its people can afford a decent life—and whether those who govern can explain the gap between national growth and personal well-being.
Sources and methodology
- Ministry of Statistics and Programme Implementation: GDP estimates on the 2011–12 base series.
- PPAC: Delhi petrol price history through June 2017; PPAC: October 2026 fuel-price notices; PPAC: petroleum-sector contribution to government exchequers.
- MoSPI: GDP base-year revisions and the new 2022–23 base year.
- NITI Aayog: power-sector analysis and CEA utility-generation figures.
- Central Electricity Authority: annual reports.
- World Happiness Report 2013: India’s score for the 2010–12 survey period; World Happiness Report 2015; World Happiness Report 2019: long-run decline and India’s fall in life evaluations; World Happiness Report 2026.
- IMF, 2018: India’s growth following disruptions related to demonetisation and GST rollout; IMF 2018 Article IV staff report, including analysis of demonetisation and GST transition costs.
- World Bank: June 2025 update to global poverty lines and India estimates.
- MoSPI: Periodic Labour Force Survey, July 2023–June 2024.
- Reuters: voter-verification exercise and reported categories of deletions, 9 October 2026.
- Reuters: Delhi protest and detentions, 10 October 2026.
- The Indian Express: Maharashtra electoral-roll age-data glitch, corrected 6 October 2026.
- The Indian Express: Bombay High Court at Goa raises concerns about voter exclusion, 6 October 2026.
- Supreme Court of India: Electoral Bonds Scheme judgment materials.
- Reporters Without Borders: India country profile and World Press Freedom Index.
Editorial note: The first line chart uses two endpoints per series and must not be read as an annual time series. The happiness timeline uses reported edition scores based on multi-year survey windows, generally three years; it is not a monthly measure and cannot establish that a single event caused a score change. Contextual events are placed beside the chronology, not presented as proven causes. Voter-roll deletion categories are approximate reported classifications, not verified counts of eligible voters unlawfully excluded. Allegations of electoral fraud are not presented as established findings.