



Original Coverage & Source Attribution: www.theglobeandmail.com
Key Points
-
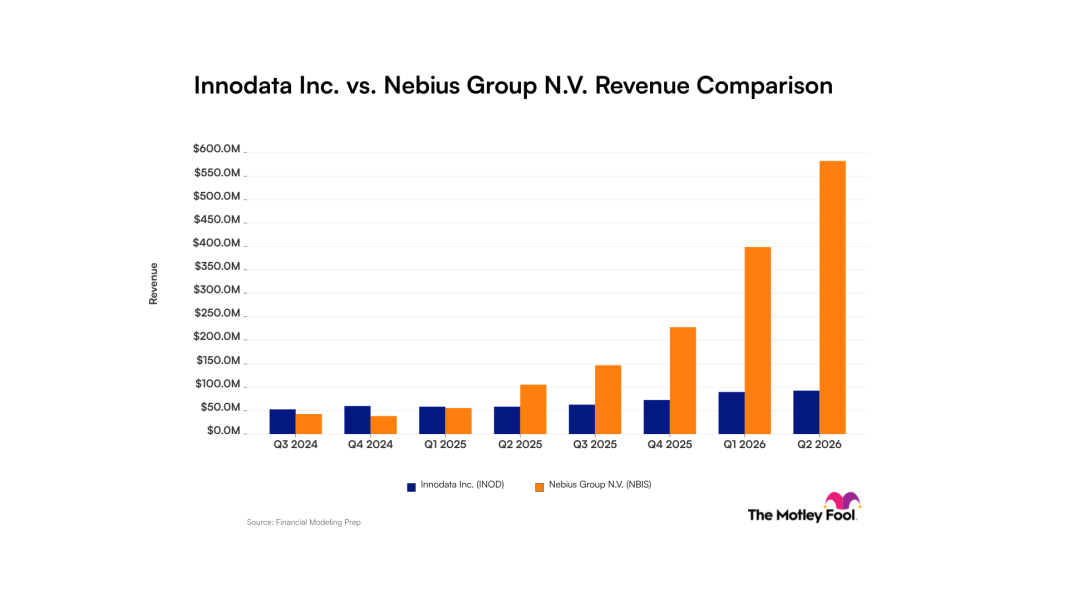
Nebius currently demonstrates higher overall revenue generation than Innodata, leading the comparison in five of the eight available quarters.
-
Both companies managed to increase total revenue over the last eight quarters, though Nebius reported larger quarter-over-quarter gains while Innodata maintained a more gradual growth trajectory.
-
Investors should monitor the underlying trends to see whether the revenue gap between Innodata and Nebius continues to widen in upcoming quarters or begins to narrow.
Innodata: Gradual and Steady Revenue Increases
Innodata(NASDAQ:INOD) primarily generates its revenue by providing data engineering services and software platforms to businesses training algorithms.
It formalized a leadership transition by appointing a new chief executive officer, and it opened a research and development laboratory in New York.
Nebius: Accelerating Revenue Gains Over Recent Quarters
Nebius(NASDAQ:NBIS) earns most of its revenue by building dedicated infrastructure and managed cloud platforms for technology developers.
It entered into a partnership agreement with Palantir Technologies, and it acquired an inference optimization technology company to integrate into its internal systems.
Why Revenue Matters for Investors
Revenue helps investors evaluate a company’s ability to attract and retain paying customers over time.
<![CDATA[]]>
Innodata vs. Nebius Revenue over the last 8 quarters.
Quarterly Revenue for Innodata and Nebius
| Calendar quarter | Innodata Revenue | Nebius Revenue |
|---|---|---|
| Q3 2024 | $52.2 million (quarter ended Sept. 30, 2024) | $43.3 million (quarter ended Sept. 30, 2024) |
| Q4 2024 | $59.2 million (quarter ended Dec. 31, 2024) | $37.9 million (quarter ended Dec. 31, 2024) |
| Q1 2025 | $58.3 million (quarter ended March 31, 2025) | $55.3 million (quarter ended March 31, 2025) |
| Q2 2025 | $58.4 million (quarter ended June 30, 2025) | $105.1 million (quarter ended June 30, 2025) |
| Q3 2025 | $62.5 million (quarter ended Sept. 30, 2025) | $146.1 million (quarter ended Sept. 30, 2025) |
| Q4 2025 | $72.4 million (quarter ended Dec. 31, 2025) | $227.7 million (quarter ended Dec. 31, 2025) |
| Q1 2026 | $90.1 million (quarter ended March 31, 2026) | $399.0 million (quarter ended March 31, 2026) |
| Q2 2026 | $92.1 million (quarter ended June 30, 2026) | $582.3 million (quarter ended June 30, 2026) |
Data source: Financial Modeling Prep. Data as of Oct. 13, 2026.
Foolish Take
Back in 2024, Innodata produced greater sales than Nebius. Since then, the latter’s revenue trend reveals its sales exploded in 2025, only to grow faster in 2026. This demonstrates the massive demand Nebius is experiencing for its advanced computing infrastructure amid the artificial intelligence boom.
Despite its revenue trajectory, Nebius could be out of business in a few years. According to research giant Gartner, 80% of neoclouds, such as Nebius, could disappear by 2030, pointing out that over $3.5 trillion in AI infrastructure spending could be exposed to impairment that year.
Innodata is also an AI player, but it doesn’t face the same kind of risk as Nebius. The company’s sales growth isn’t as strong, yet it is profitable, delivering net income of $14.4 million in the second quarter of 2026, about double the $7.2 million produced in 2025. Meanwhile, Nebius posted a Q2 net loss of $190.4 million.
Should you buy stock in Innodata right now?
Before you buy stock in Innodata, consider this:
The Motley Fool Stock Advisor analyst team just identified what they believe are the 10 best stocks for investors to buy now… and Innodata wasn’t one of them. The 10 stocks that made the cut could produce monster returns in the coming years.
Consider when Netflix made this list on December 17, 2004… if you invested $1,000 at the time of our recommendation, you’d have $380,579!* Or when Nvidia made this list on April 15, 2005… if you invested $1,000 at the time of our recommendation, you’d have $1,359,789!*
Now, it’s worth noting Stock Advisor’s total average return is 931% — a market-crushing outperformance compared to 212% for the S&P 500. Don’t miss the latest top 10 list, available with Stock Advisor, and join an investing community built by individual investors for individual investors.
*Stock Advisor returns as of October 16, 2026.
Robert Izquierdo has positions in Palantir Technologies. The Motley Fool has positions in and recommends Innodata and Palantir Technologies. The Motley Fool recommends Gartner. The Motley Fool has a disclosure policy.